Build a report
Turn live dashboards into a document you can export, from a saved report or the organization overview.
A report gathers data from your devices and streams into a document you can read, export, or send on a schedule. Start from a live, no-setup view, or build a saved report you keep.
Start from the overview#
Open Reports. The Organization overview card gives you a live view across every device and stream, with no setup. Use the filter bar at the top to narrow it to a site, a device type, or a date range.
Create a saved report#
Select Create report to start a report you can keep and reuse.
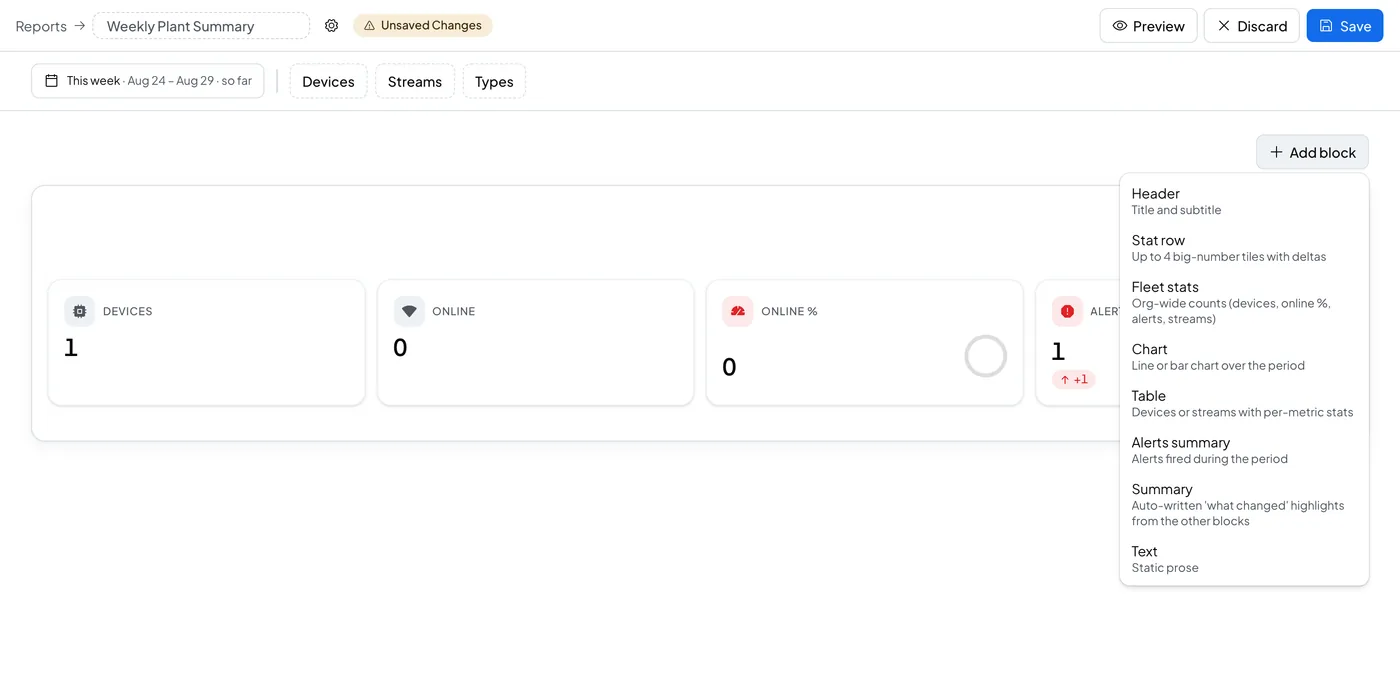
Select + Add block to add a piece of content. Each block shows one kind of data:
- Header: a title and subtitle
- Stat row: up to four numbers, such as an average or a total
- Fleet stats: device counts and alert counts across the organization
- Chart: one metric, plotted over time
- Table: one or more metrics, one row per device
- Alerts summary: alert counts by severity
- Summary: a short list of what changed
- Text: your own notes
Set the filter bar before you save. It becomes the report's scope, and every block reads from that same scope.
Export#
Open a report and select Export PDF or Download HTML to save the current view as a file.
If Reports is not enabled#
If your organization does not have Reports turned on, the page shows this instead: