Monitor a silo remotely
Put live silo weight on a dashboard, from the load cells under the legs to the low stock alert on a phone.
A silo in Logable stores one reading: weight. Load cells under the legs measure it, an indicator turns the load-cell signal into a number, and a gateway sends that number to Logable. This guide covers the six steps from an empty account to an alert on a phone.
1. Add the silo as a device#
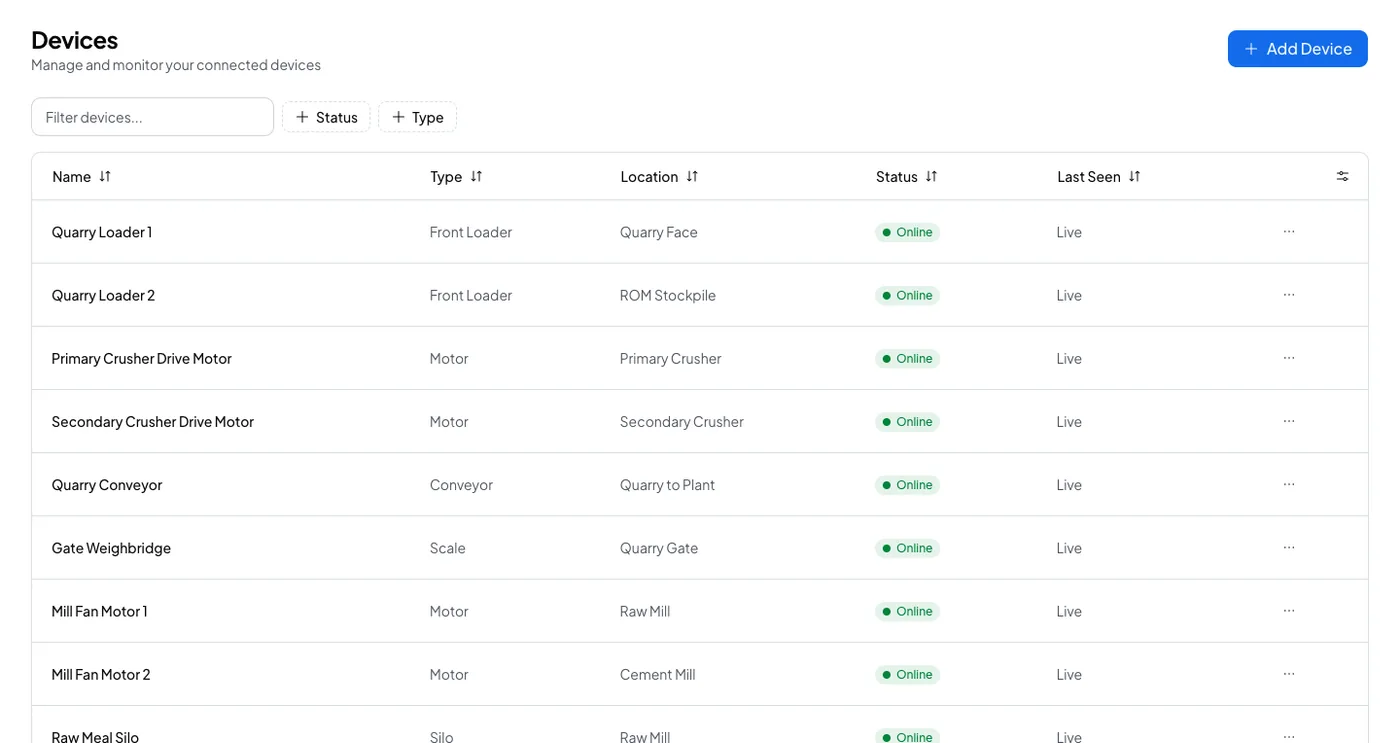
Open Devices and select Add Device. Pick the Silo type, then name the device after the plant asset, not after the sensor. "Raw Meal Silo" is a name a shift supervisor recognises. "Load cell 3" is not.
Step 3 of the wizard asks for the configuration. A silo needs:
- Capacity, the full quantity the silo holds. Every silo preset is a percentage of this number, so a wrong capacity makes every alert wrong.
- Weight unit, tons or kilograms.
- Material, which is a label only. It changes no calculation.
Turn on Enable status tracking so Logable flags the silo when it stops reporting.
2. Copy the credentials#
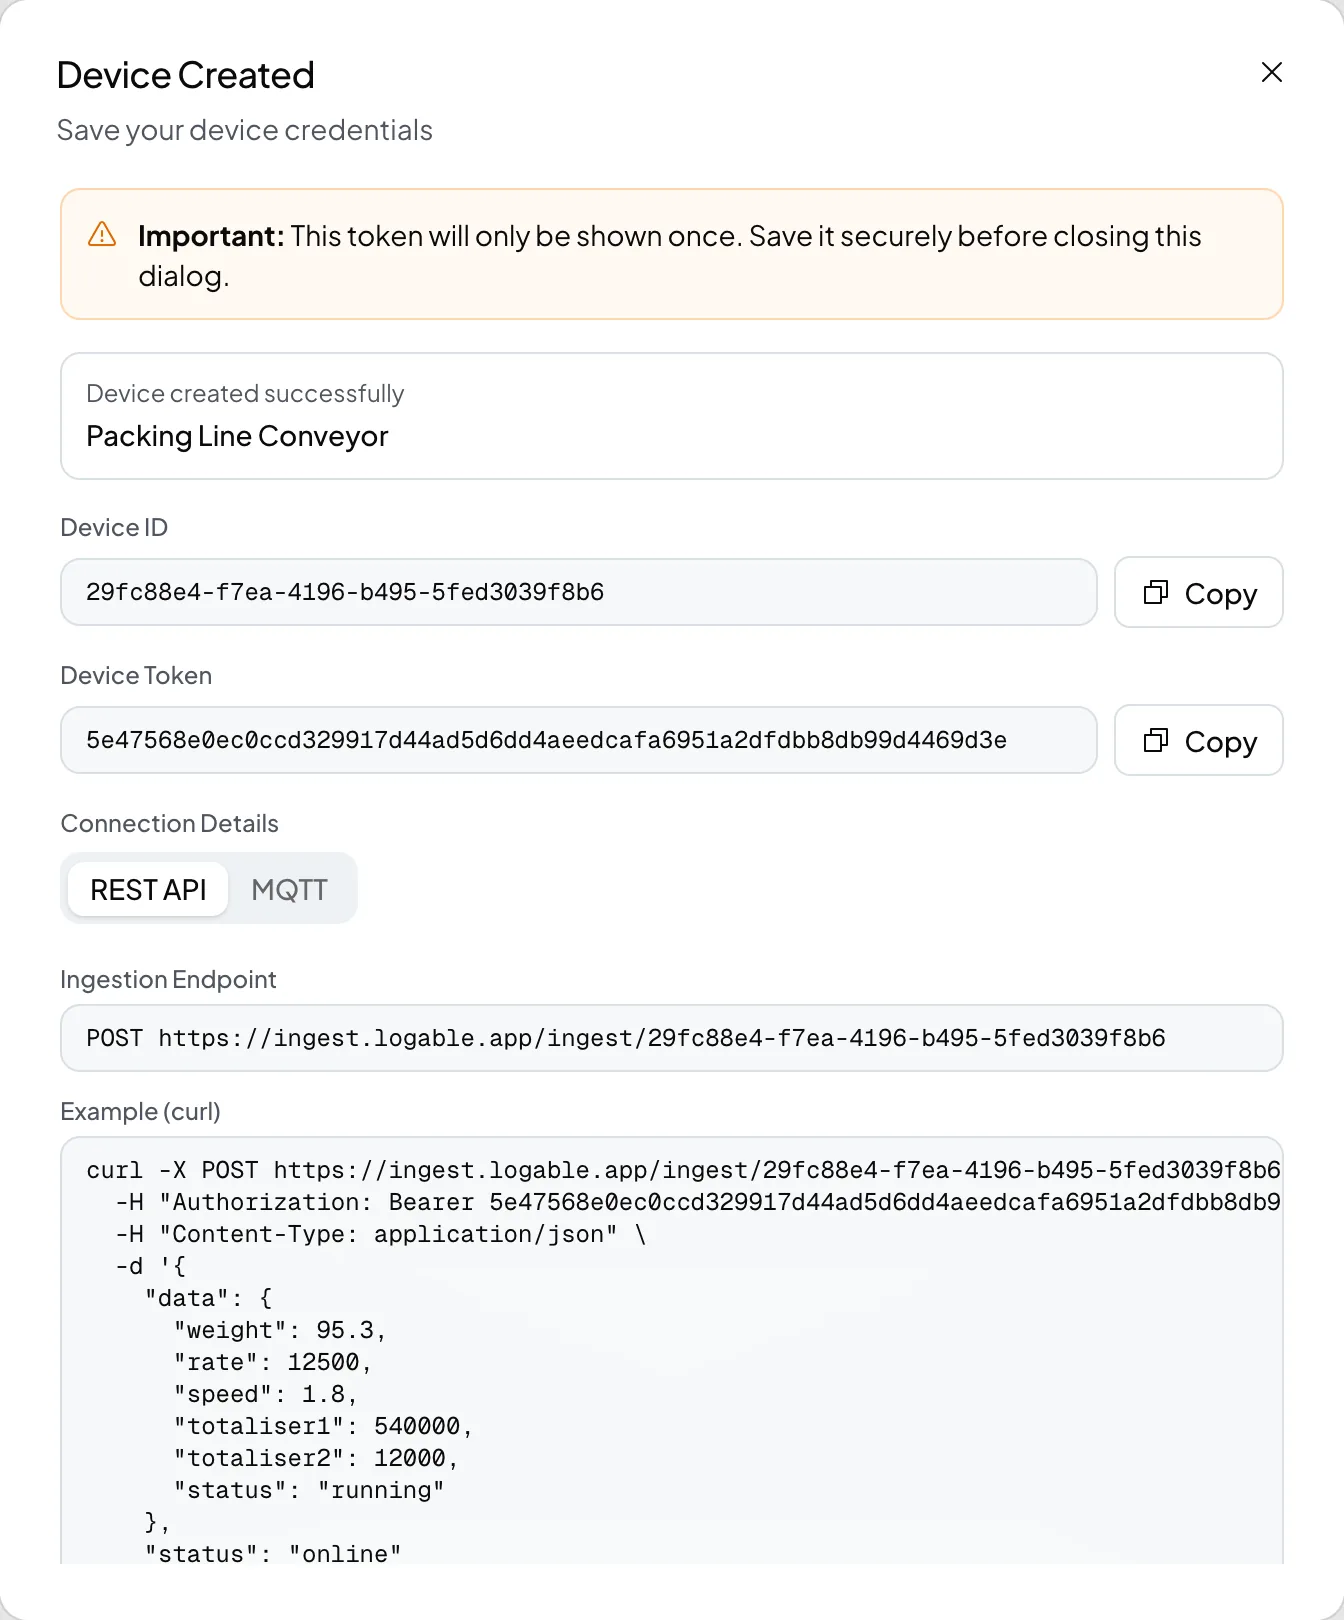
Step 4 of the wizard shows the Device ID and the Device Token. The token is shown once. Copy it now, or select Download Credentials to save both to a file.
A gateway with a small trust store may also need a CA file. The same step offers the download. Upload the root certificate to the gateway, never the server certificate.
3. Send the weight#
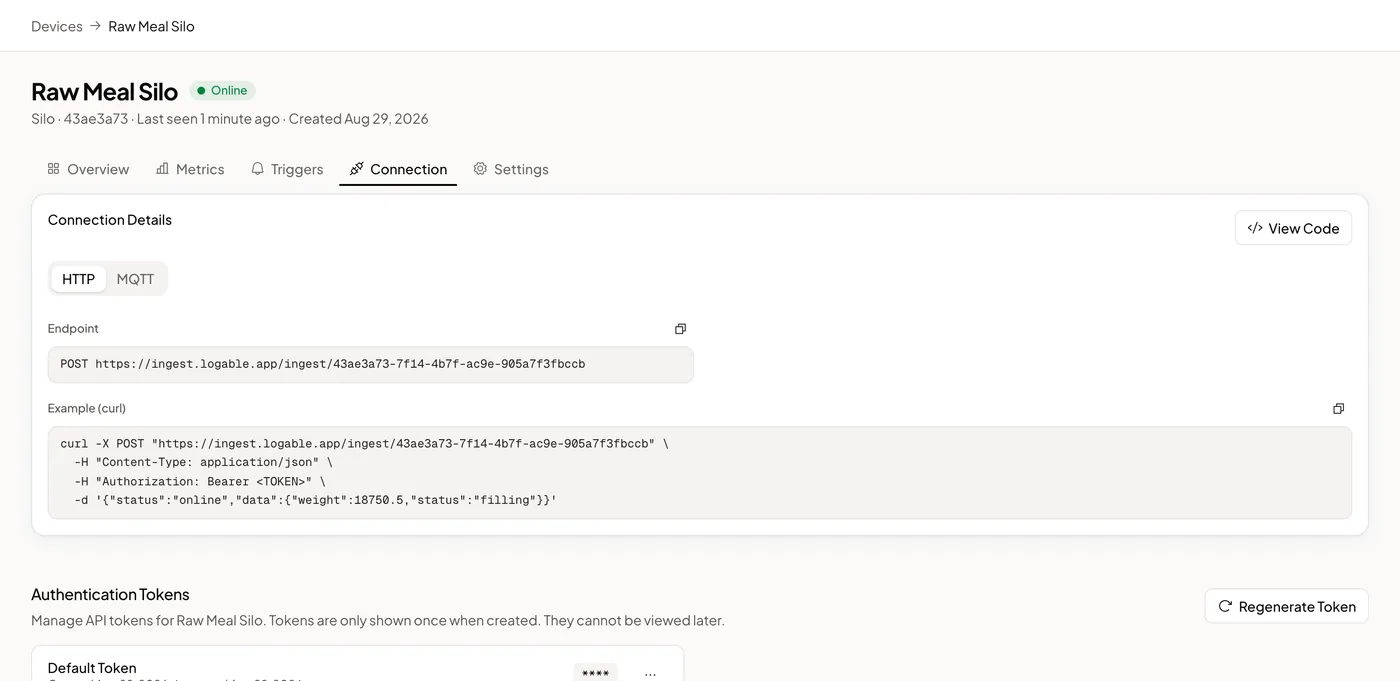
A silo sends one metric, weight. Publish it to devices/<DEVICE_ID>/data over MQTT, or post the same body to the ingest endpoint over HTTPS.
{
  "timestamp": "2026-09-12T08:30:00.000Z",
  "status": "online",
  "data": { "weight": 312.4 }
}
Send a reading every minute. Silo weight moves slowly, and a minute is fast enough for the presets to see a draw-down while it happens.
If the indicator speaks Modbus RTU or Modbus TCP, Logable does not read it directly. A gateway polls the indicator and publishes the result. See Connect PLCs and Modbus devices via a gateway for the setup.
4. Put it on a dashboard#
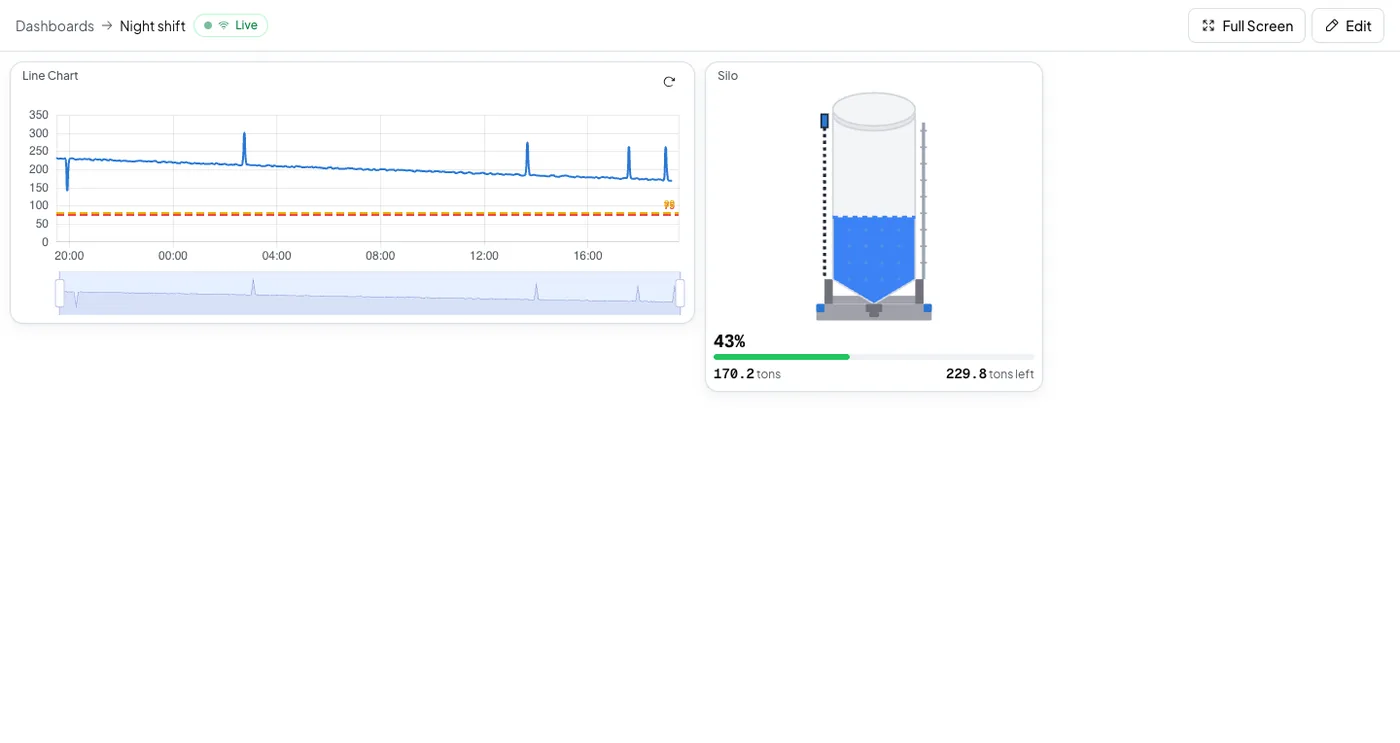
Open Dashboards, select Create dashboard, and choose Create from template. The Silo stock template lays out the level widget, the weight chart and the device status for you. Pick the silos you added and save.
5. Add the alerts#
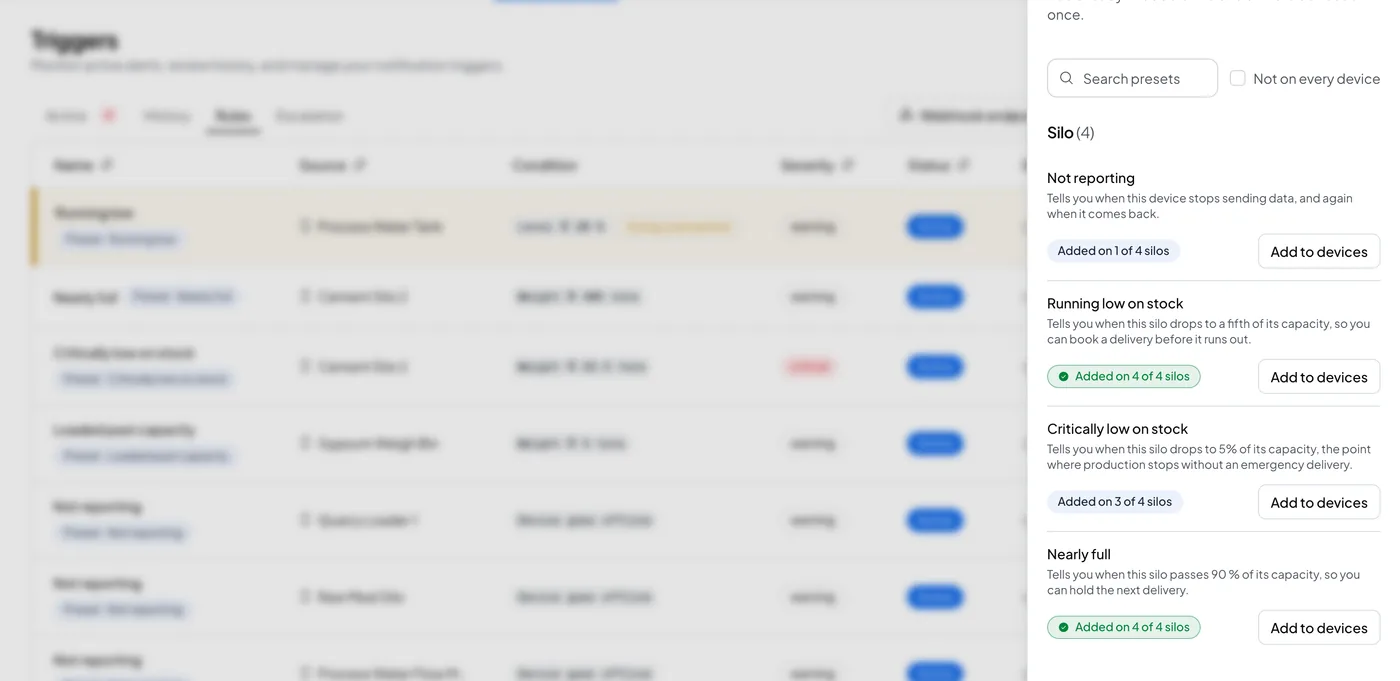
Open the silo's Triggers tab and select Browse presets. Four presets apply to a silo:
| Preset | Fires at | What you do |
|---|---|---|
| Running low on stock | 20 percent of the capacity you set | Book a delivery |
| Critically low on stock | 5 percent of capacity | Arrange an emergency delivery |
| Nearly full | 90 percent of capacity | Hold or redirect the next delivery |
| Not reporting | Five minutes of silence, or three times the reporting interval when that is longer | Check the gateway and the link |
Each preset states the number it resolves to before you adopt it, so you know what it does without opening a rule form. You can change the number afterwards.
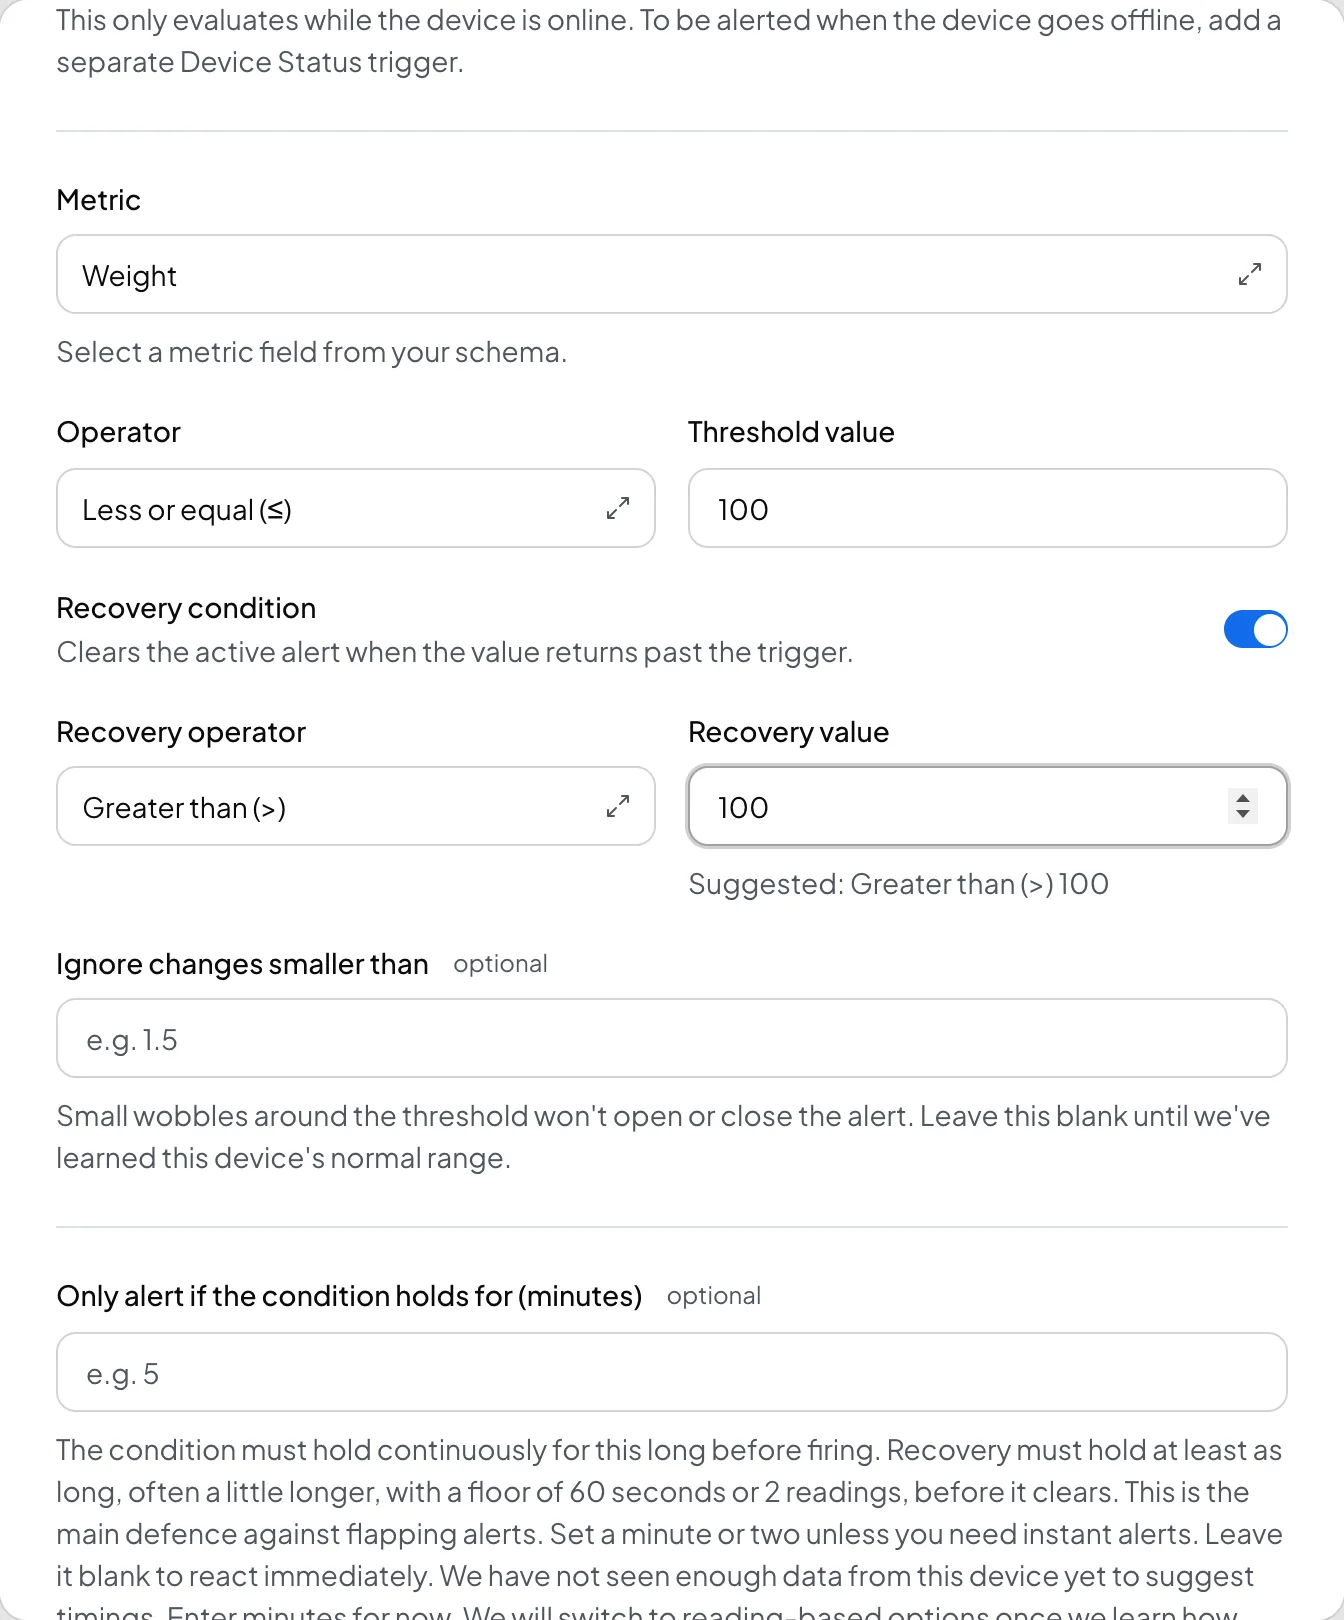
If a preset does not fit, select Create Trigger on the same tab instead. Set the metric, the operator, the threshold, and a recovery condition that clears the alert when the reading passes back over it.
6. Check it arrived#
Open the device's Connection tab. The device log shows every message the silo sends, what was accepted, and what was rejected and why. A wrong topic, a wrong token or a bad value type each show as a row with the reason and the fix.
Read next#
- Silo monitoring, the whole picture for a plant with several silos.
- Silo device type reference, every metric and configuration field.
- Publish readings over MQTT, the full connection reference.