Build a dashboard
Put your devices on one screen. Pick widgets, choose the device in each, size them, and save.
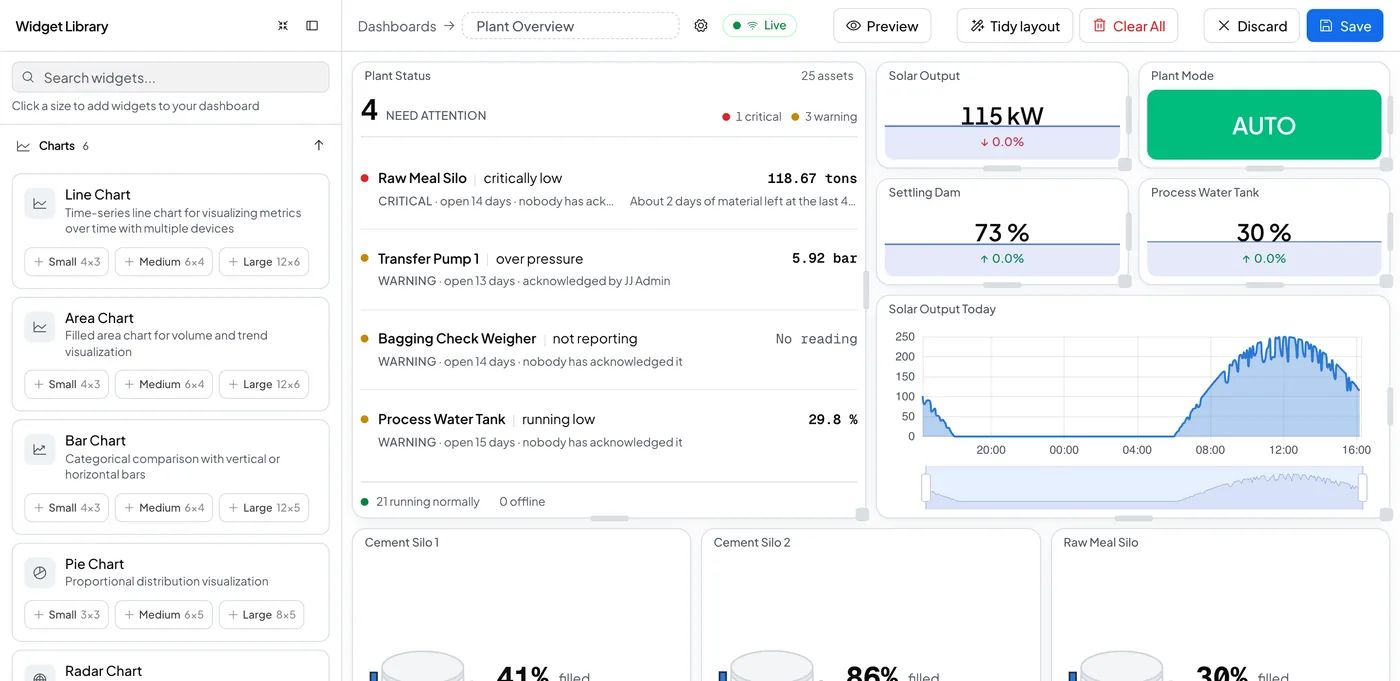
A dashboard is a screen of widgets. Each widget shows one device, or one stream, in one shape: a chart, a gauge, a stat, or a visual built for that equipment.
- Open Dashboard and select Create dashboard. Logable opens a new dashboard in edit mode, named after the date and time. Rename it in the title field at the top.
- In the Widget Library sidebar, pick a category: Charts, Device or Data.
- Pick a widget type, then click a size, Small, Medium or Large, to add it to the dashboard.
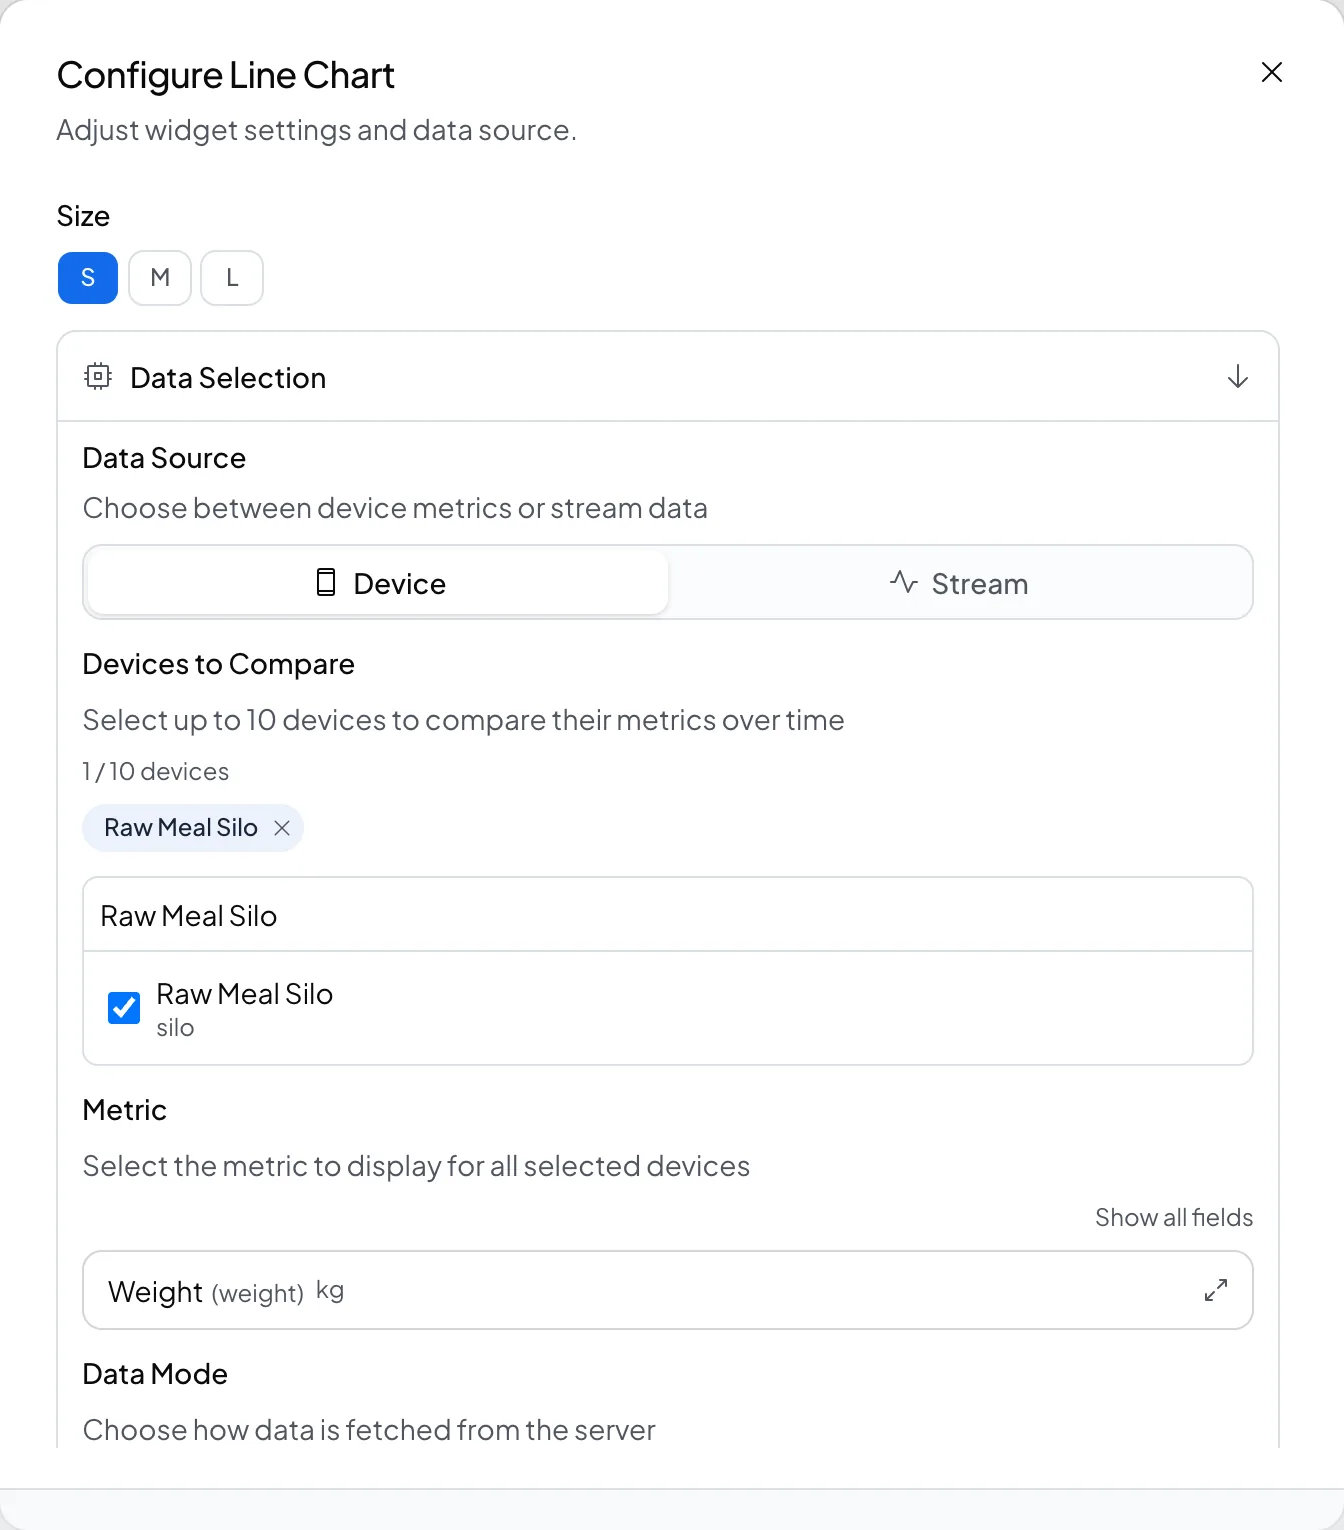
- Select Configure on the new widget. Set Size, Data Source (device or stream), Metric, and Time Range (Daily, Weekly or Monthly). This is where you pick the device. The Widget Library only chose the type and the size.
- Select Save Configuration.
- Drag a widget to move it. Select Change size to resize it later, or Lock it so it does not move by accident.
- Select Tidy layout to pack every widget together, then select Save.
Who can do this#
A viewer opens a dashboard and reads it. A member also only reads it. An admin or an owner can create a dashboard and edit one.