See every Modbus device.
On one dashboard.
A gateway on your network reads your flow meters, drives and sensors, whether they speak Modbus RTU or Modbus TCP. You see every reading on one dashboard and get the alert on your phone when one drifts.
- Nothing opened up
- one encrypted connection out
- RTU and TCP
- one gateway reads both
- Alerts included
- the right person is told first

Every Modbus device on one list.
Flow Meter 12 reports 41.2 m³/h. The gateway reads it the same way it reads a drive, a scale or a sensor, whether the device speaks Modbus RTU or Modbus TCP.
- One dashboard for every deviceFlow meters, drives, scales and sensors, all on the same screen.
- Know when one driftsSet a limit on any value. The right person gets the reading before the line stops.
- Nothing on the internetThe gateway sends readings out over one encrypted connection. Nothing comes in.
| Time | instantFlow | totalFlow |
|---|---|---|
| 09:41 | 41.2 | 1 284.1 |
| 09:40 | 41.0 | 1 283.4 |
| 09:39 | 41.3 | 1 282.7 |
Devices that already speak Modbus
Each type comes with the metrics and dashboard widgets already set up. Add a device and it just works.
A silo running low books its own delivery.
Fill level and weight, on the same dashboard as everything else.
A stopped belt does not wait to be found.
Belt scale throughput, belt speed and a running total.
A drive tells you before it trips.
RPM, power draw, temperature and run status.
A pump running against a closed valve says so.
Flow rate, pressure, power and efficiency.
Every load is weighed on the way out.
Weight, with stability and calibration state.
A line losing flow is caught before the tank runs dry.
Instantaneous and total flow, with direction.
A batch that misses its target is caught on the shift.
Batch weighing, with the open and close state.
An underweight pack is caught at the line, not at the depot.
In-motion weighing and count verification.
What comes back from a register
The gateway maps registers to named values with units, so a dashboard shows flow rate and temperature rather than register 40001.
| Reading | Unit | What it tells you | Where it comes from |
|---|---|---|---|
| Instantaneous flow | L/min | whether the line is moving what it should | the meter's holding register |
| Total flow | L | what actually moved this shift | the meter's own totaliser |
| Discharge pressure | bar | a blockage or a closed valve | the pressure transmitter on the skid |
| Drive speed | rpm | a drive slowed or stopped | the VFD's Modbus register |
| Weight | kg | the load on the platform | the indicator's serial output |
From the meter to the phone
A gateway on your own network reads every Modbus device, serial or Ethernet, and sends each reading to Logable over one encrypted connection. The device never touches the internet.
- Flow meterRS-485 · Unit 12Pump driveEthernet · Unit 1
- Modbus RTUModbus TCP
- GatewayPolls · Publishes
- MQTT, encrypted
- Logable CloudOne dashboard
One gateway handles both wiring types, so a new flow meter or drive is wired to the gateway, not connected to Logable a second way.
One gateway, both protocols
| Protocol | How it reaches Logable | Notes |
|---|---|---|
| MQTT | Direct to Logable | The gateway publishes every reading to Logable over MQTT with TLS. |
| HTTPS | Direct to Logable | A gateway can post the same readings to the Logable API instead. |
| Modbus RTU | Through a gateway | Serial devices on RS-485 are polled by the gateway on your own network. |
| Modbus TCP | Through a gateway | Ethernet devices are polled by the same gateway. Logable never speaks Modbus itself. |
A gateway on your own network polls RS-485 and Ethernet devices at the interval you set and publishes upward over one encrypted connection. See how to connect a PLC or a Modbus device via a gateway.
Every Modbus device on one screen
Flow meters, drives, scales and sensors on the same dashboard, updating as each poll lands.
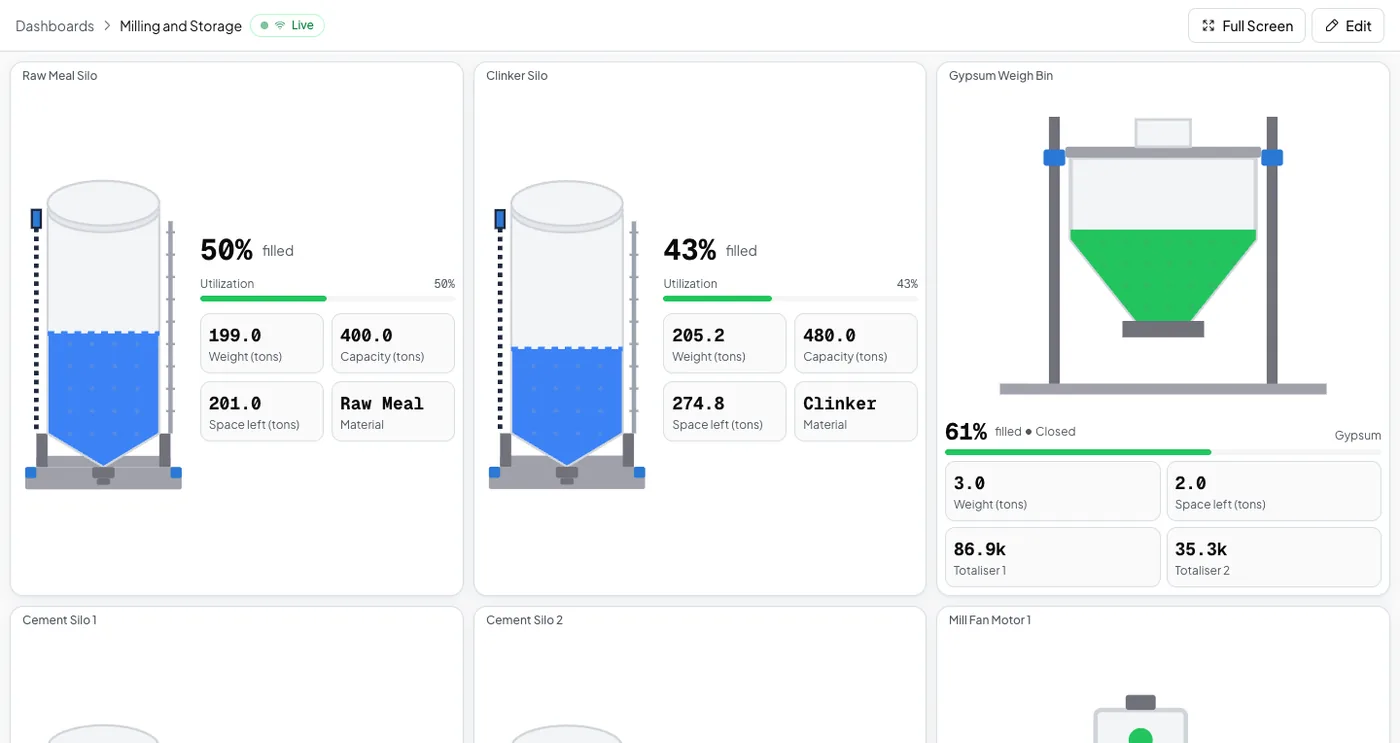
RTU or TCP, the gateway reads it. You never touch the wiring.
Add a flow meter, a drive or a sensor and the same gateway picks it up. Nothing changes on your network.
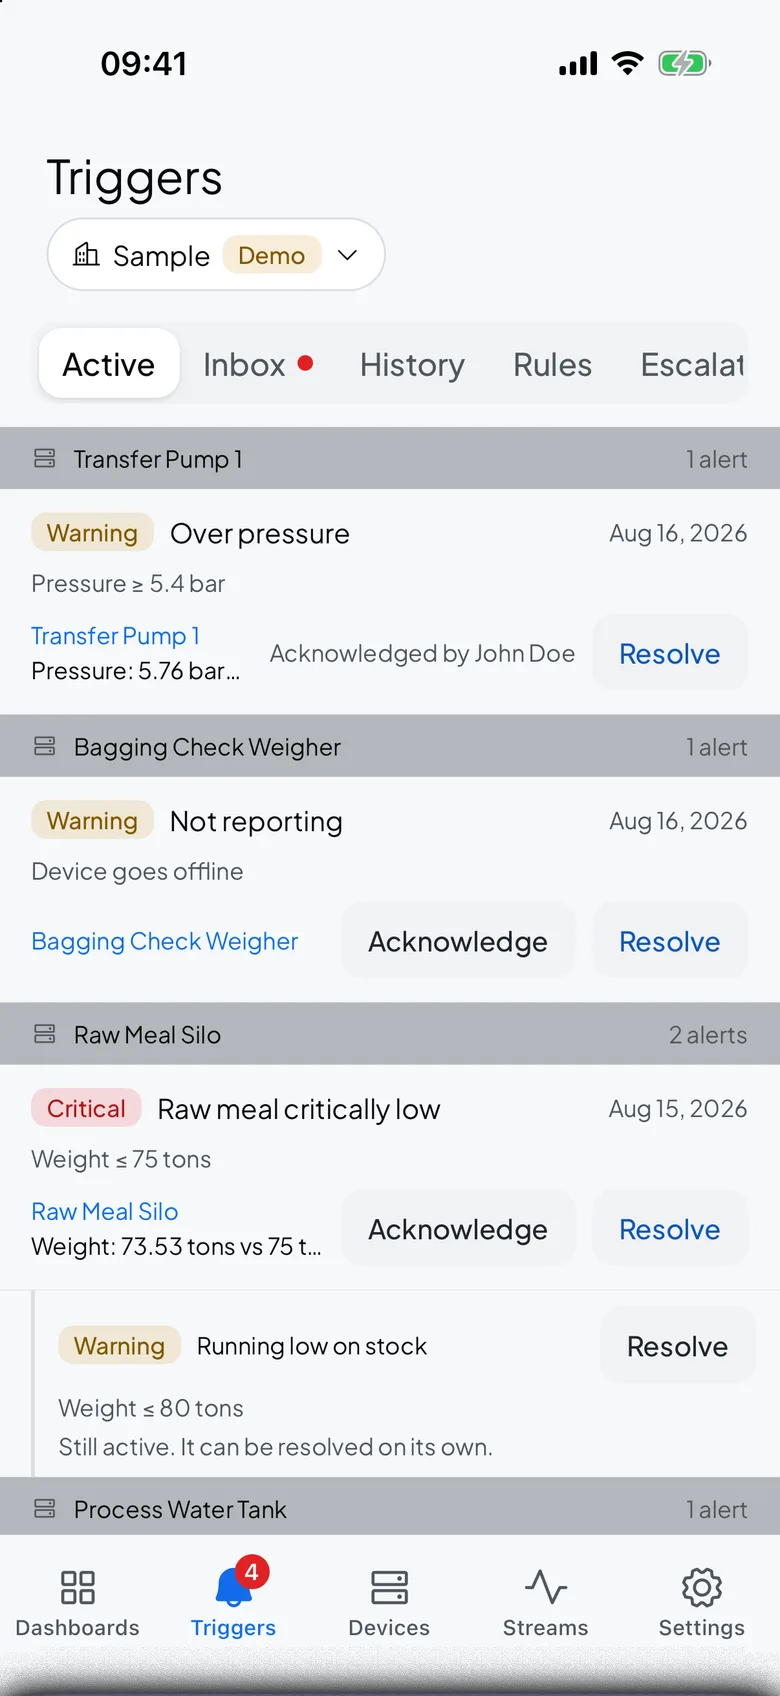
A limit on any register
Four rules cover what a Modbus fleet reports going wrong.
- Low flow
Tells you when flow drops to the low threshold you set on this meter.
- Over pressure
Tells you when discharge pressure reaches 90 % of the pump’s rated maximum.
- Belt stopped
Tells you when the belt stops moving. Only add this to a belt that is meant to run continuously. It will also fire on planned stops.
- Not reporting
Tells you when this device stops sending data, and again when it comes back.
The reading, wherever you are.
Flow Meter 12 falls to 8.4 L/min at 03:40. The push carries the device and the value, so the decision is made before anyone drives out.
- One dashboard for every deviceFlow meters, drives, scales and sensors, all on the same screen.
- Know when one driftsSet a limit on any value. The right person gets the reading before the line stops.
- Nothing on the internetThe gateway sends readings out over one encrypted connection. Nothing comes in.
What goes wrong on a Modbus fleet
Three failures a serial loop cannot tell anyone about on its own.
| What happens | What you see today | What Logable does |
|---|---|---|
| A line loses flow overnight. | The tank is found empty in the morning. | The low-flow alert fires when the meter drops under its limit.Low flow |
| A pump runs against a closed valve. | The seal fails before anyone reads the gauge. | A phone alert carries the over-pressure reading.Over pressure |
| A gateway loses power. | Every dashboard on that loop quietly stops moving. | The not-reporting alert names each device that went silent.Not reporting |
Modbus RTU vs Modbus TCP
Both protocols are fully supported through IoT gateways. Here is how they compare.
| Modbus RTU | Modbus TCP | |
|---|---|---|
| Physical Layer | RS-485 serial (wired) | Ethernet / Wi-Fi |
| Speed | Up to 115.2 kbps | 10/100/1000 Mbps |
| Distance | Up to 1,200m (RS-485) | Standard network reach |
| Addressing | Each device has its own address | IP address, plus each device's own address |
| Common Use | Legacy devices, field instruments | Modern PLCs, VFDs, meters |
What you get with Modbus monitoring
The dashboard, the alerts and the phone, on top of the devices you already have.
What it costs
One gateway can serve a whole RS-485 loop. You pay for the devices you watch.
The trial runs 14 days with 5 devices and Growth features, and asks for no card. Industry plans are quoted per site.
The gateway is bought once from your supplier and is not a Logable cost.
Frequently asked questions
What teams ask before they connect the first device.
Modbus connectivity is handled through IoT gateways, not built directly into the Logable platform. The gateway reads values from your Modbus devices and sends the data to Logable over MQTT. For other data, Logable also accepts a simple web request.
An IoT gateway is a small device or software application that sits on your local network. It reads data from Modbus devices using RS-485 (RTU) or Ethernet (TCP) and forwards it to Logable over the internet via MQTT. Yes, you need a gateway to bridge Modbus devices to the cloud.
Yes. IoT gateways support both Modbus RTU (serial/RS-485) and Modbus TCP (Ethernet). Many gateways can handle both protocols simultaneously, so you can connect legacy serial devices and modern Ethernet-connected equipment through a single gateway.
Data update frequency depends on your gateway configuration. Most gateways can check your Modbus devices every 1 to 10 seconds and send updates to Logable in real time over MQTT. You set the interval on the gateway to balance freshness with network use.
IoT gateways typically support all standard Modbus register types: coils (discrete outputs), discrete inputs, holding registers, and input registers. The gateway maps these register values to Logable metrics, so you see meaningful data like temperature, weight, or flow rate instead of raw register numbers.
Also for PLCs, SCADA and remote sites
PLC Monitoring
Connect PLCs to cloud dashboards via gateways.
Learn moreSCADA Alternative
What your SCADA does not send you.
Learn moreRemote Monitoring
Sites without an operator on hand.
Learn moreSetting up your first gateway? monitoring for manufacturing or read how to connect a PLC or a Modbus device via a gateway.
Start with one gateway and one meter
Connect the first Modbus device today. The dashboard and the alerts are ready when it reports.