Monitor a belt scale remotely
Put belt scale rate, speed and totalised tonnage on a live dashboard, and alert when the belt stops or runs overloaded.
A belt scale weighs material while the belt runs. The integrator's indicator already holds the numbers: rate in tonnes per hour, belt speed, load on the belt, and the totalisers. This guide moves those numbers onto a live dashboard and puts two alerts on them.
Logable models a belt scale as a conveyor device. One conveyor device is one weighed belt.
1. Add the belt as a device#
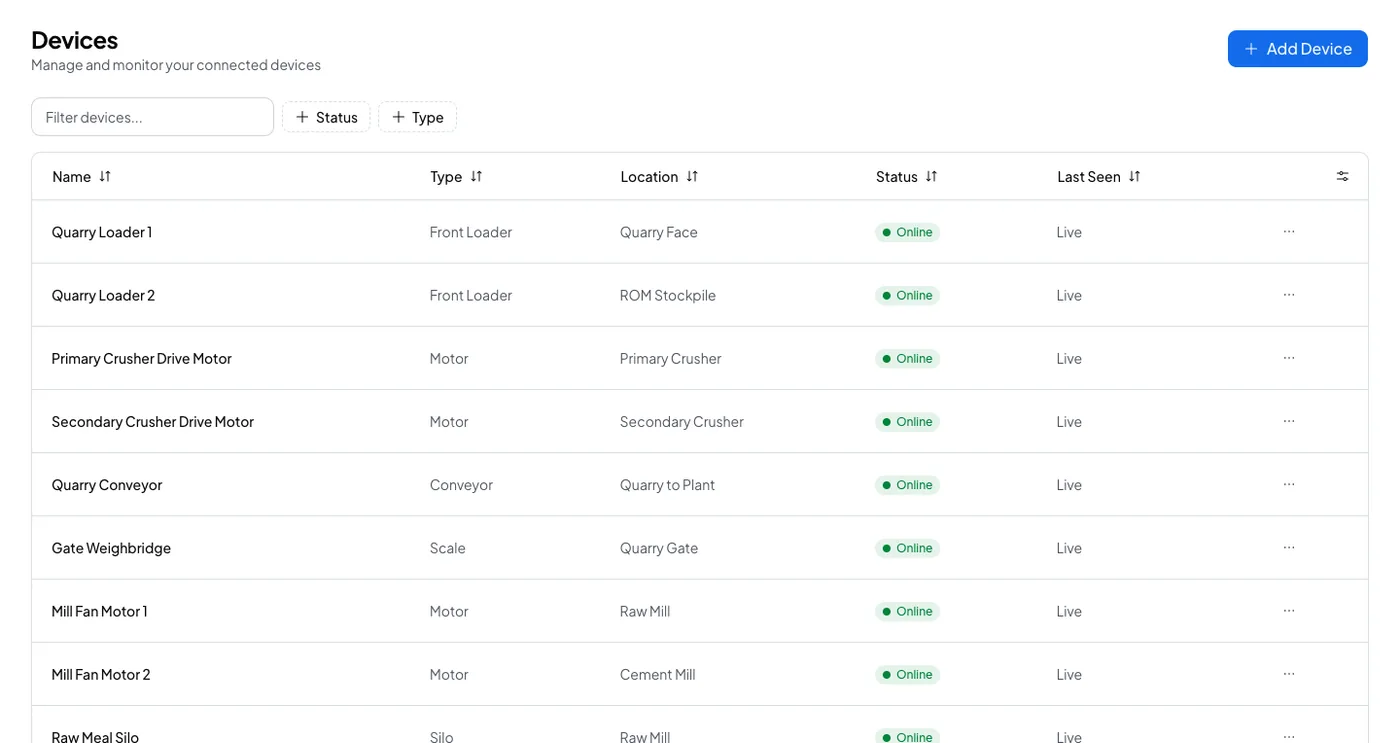
Open Devices, select Add Device, and pick the Conveyor type. Name it after the belt, such as "Quarry Conveyor".
The configuration decides what the presets compare against:
- Maximum weight, the rated load on the belt. The overload preset fires at 90 percent of it.
- Maximum rate, the rated throughput per hour, in the Rate unit.
- Speed unit, which must be
m/sfor the belt stopped preset to apply. - Weight unit, the unit for weight and the default for Rate, Capacity and the totalisers.
- Material, a label on the reading.
- Rate unit, Capacity unit, Totaliser 1 unit and Totaliser 2 unit, which are optional. See Show a different unit on one reading.
2. Copy the credentials#
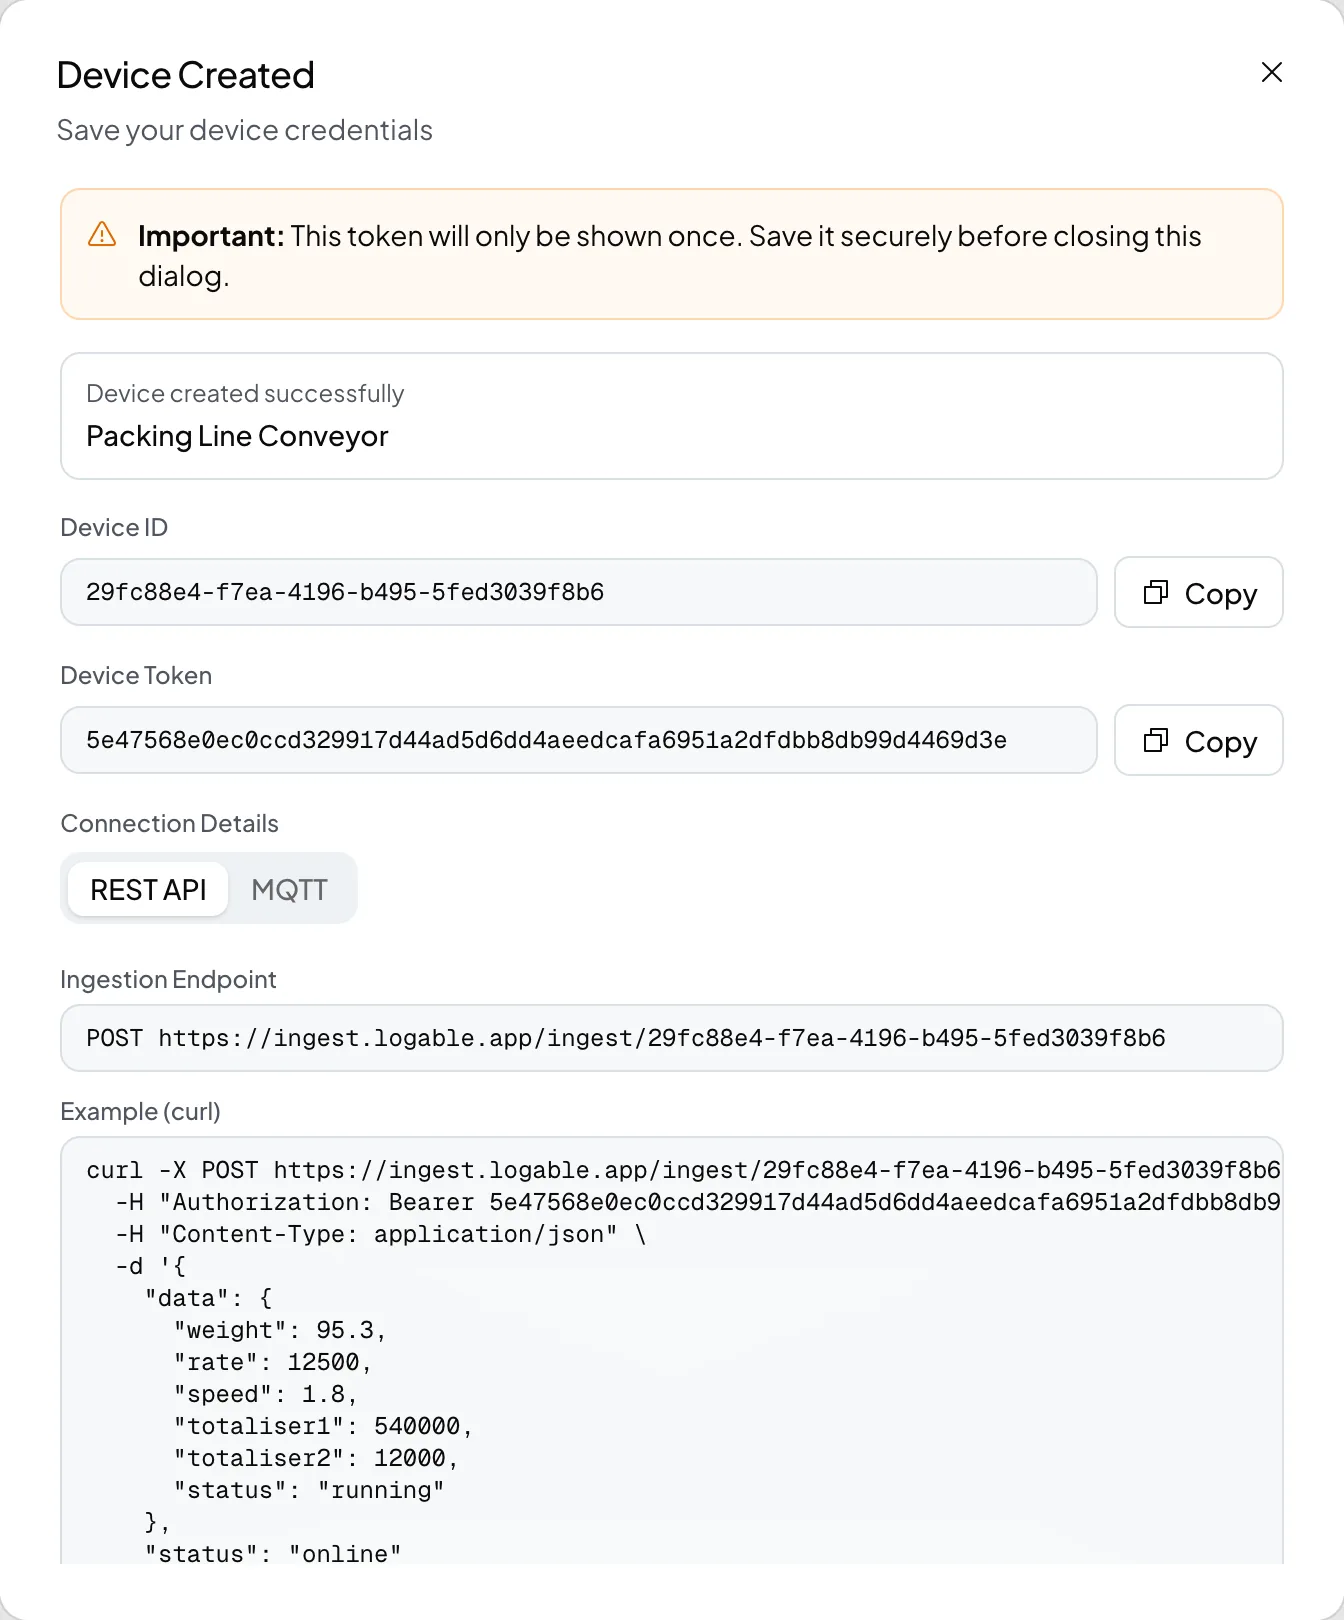
Step 4 of the wizard shows the Device ID and the Device Token, once. Copy both into the gateway's MQTT client, as username and password. Select Download Credentials if you want them as a file.
3. Send the readings#
A conveyor carries four readings worth having, plus its status:
| Metric | What it is |
|---|---|
rate | Throughput, per hour in the Rate unit |
speed | Belt speed, in metres per second |
weight | Load on the weighed span |
totaliser1 | The running total the indicator keeps |
{
  "timestamp": "2026-09-12T08:30:00.000Z",
  "status": "online",
  "data": { "rate": 612.5, "speed": 2.4, "weight": 63.1, "totaliser1": 184320 }
}
Send a reading every ten to thirty seconds. A belt changes state quickly, and the belt stopped preset needs enough readings inside its fifteen minute window to be sure.
Almost every belt scale indicator speaks Modbus RTU or Modbus TCP. Logable does not read Modbus itself. A gateway polls the indicator's registers and publishes the values as the JSON above. The register list comes from the integrator's manual, never from Logable. See Connect PLCs and Modbus devices via a gateway.
4. Put it on a dashboard#
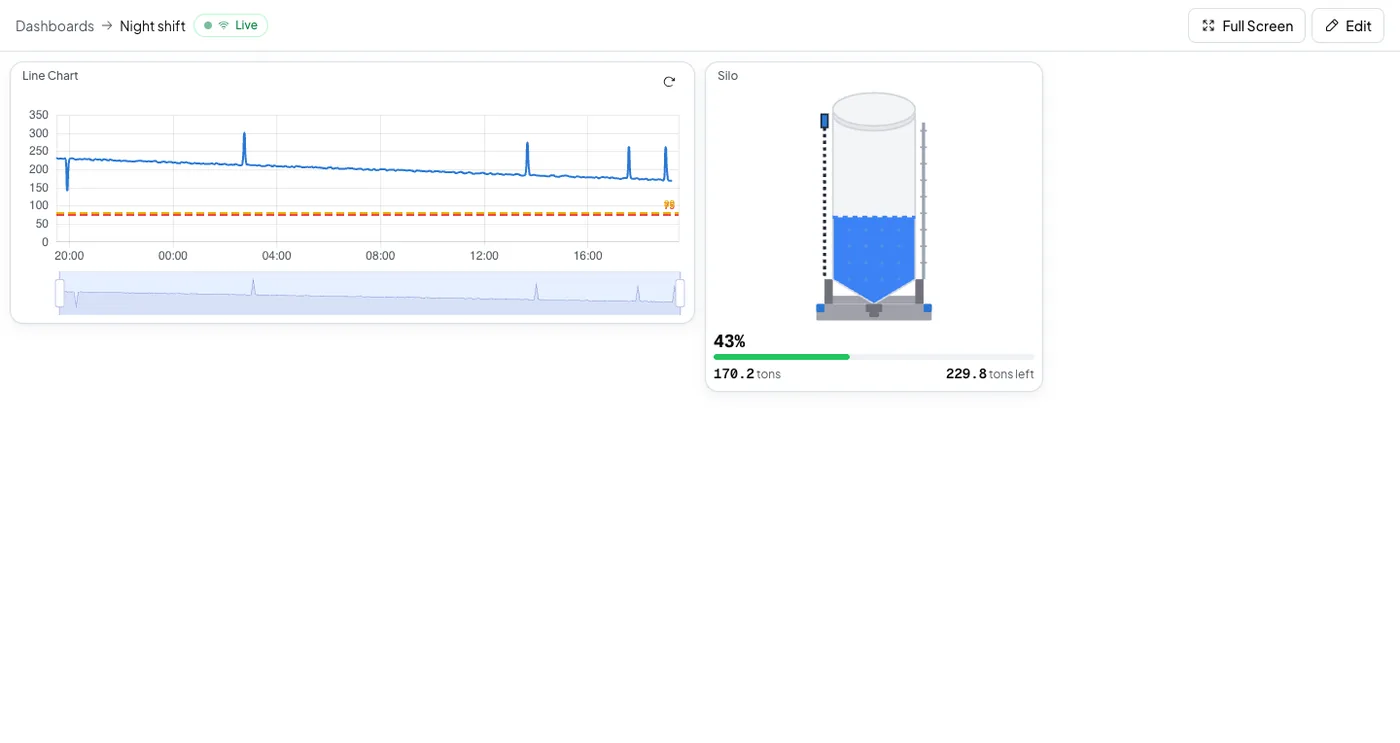
Open Dashboards, select Create dashboard, then Create from template, and choose Belt scale line. It lays out rate, belt speed and the totaliser together, which is the view an operator actually reads.
5. Add the alerts#
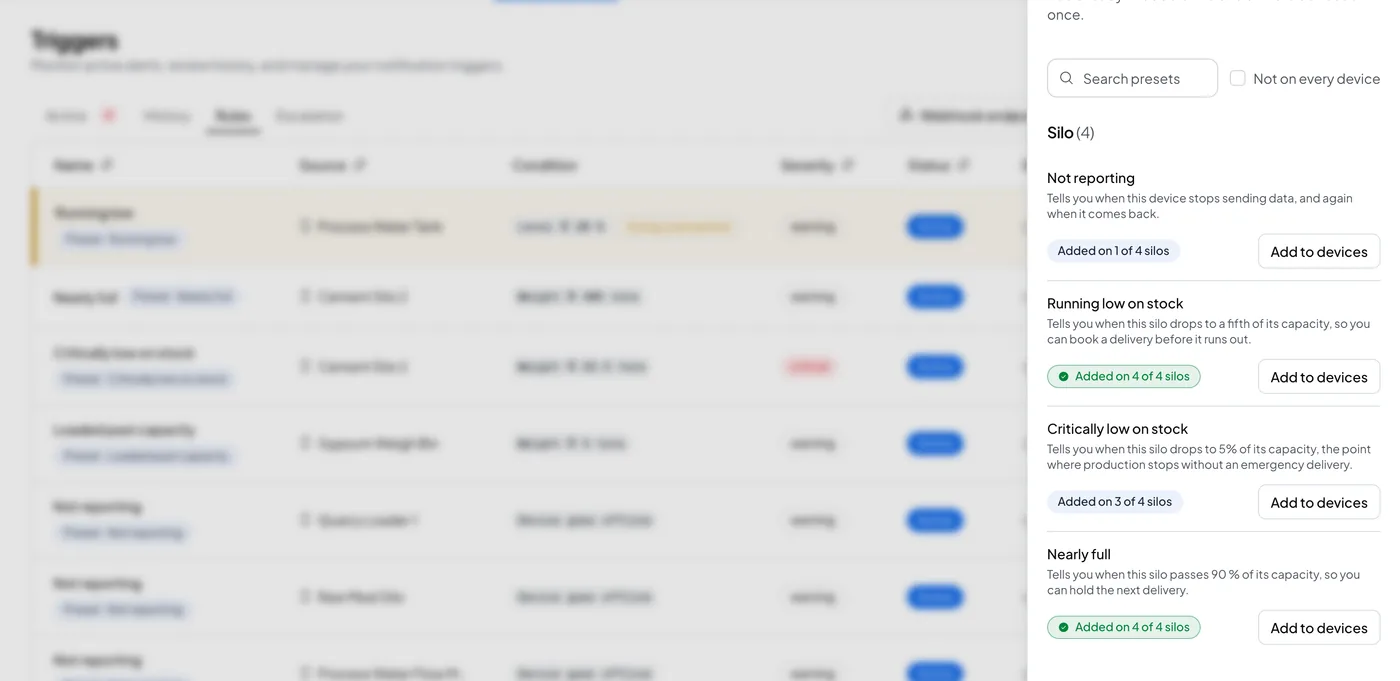
Open the belt's Triggers tab and select Browse presets.
| Preset | Fires at | What you do |
|---|---|---|
| Belt stopped | Speed near zero for fifteen minutes straight | Somebody walks to the line |
| Belt overloaded | 90 percent of the maximum weight you set | Slow the feed before the gearbox takes the strain |
| Below normal belt speed | Below the normal belt speed you set | Check the drive and the tension |
| Not reporting | Five minutes of silence, or three times the reporting interval when that is longer | Check the gateway and the link |
Belt stopped also fires on a planned stop. Add it to a belt that is meant to run continuously, and acknowledge it when the stop is planned. Acknowledging stops the reminders.
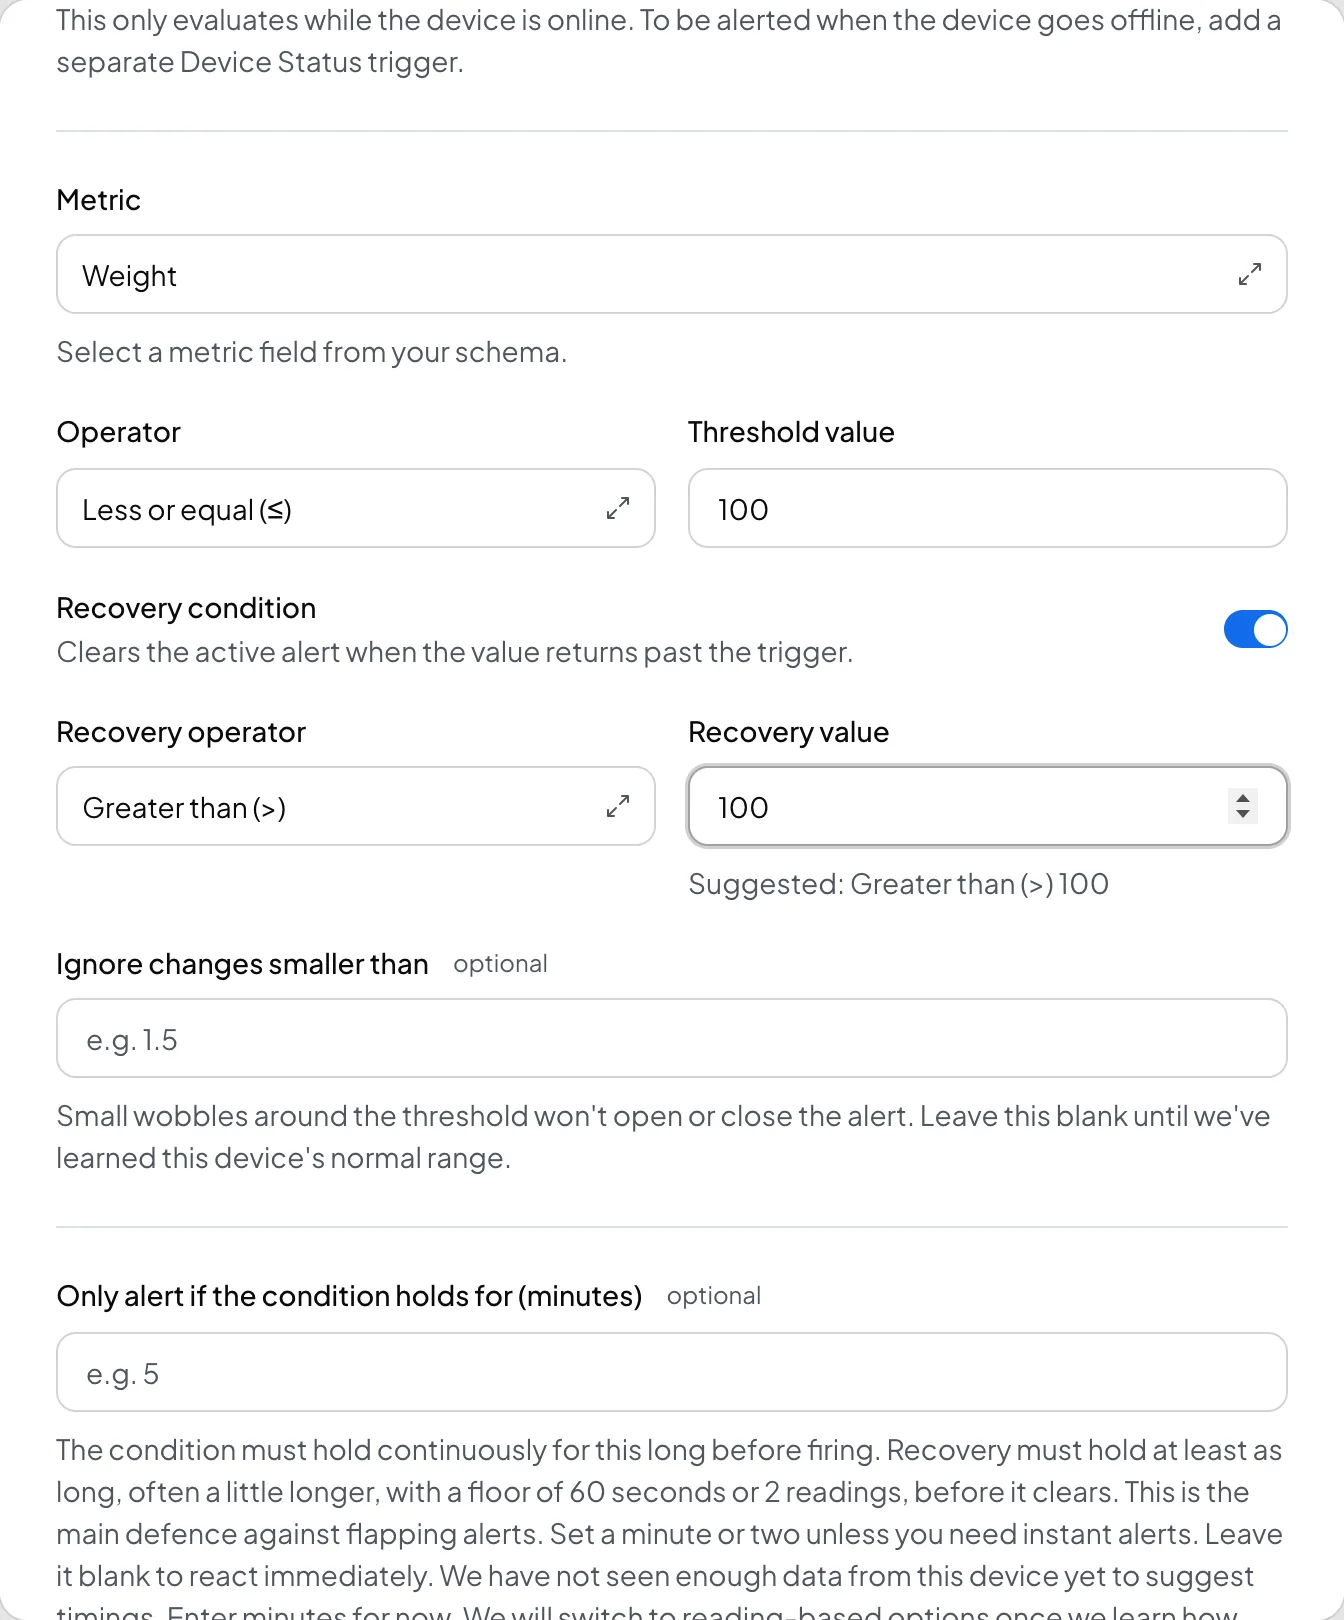
If a preset does not fit, select Create Trigger on the same tab instead. Set the metric, the operator, the threshold, and a recovery condition that clears the alert when the reading passes back over it.
6. Check it arrived#
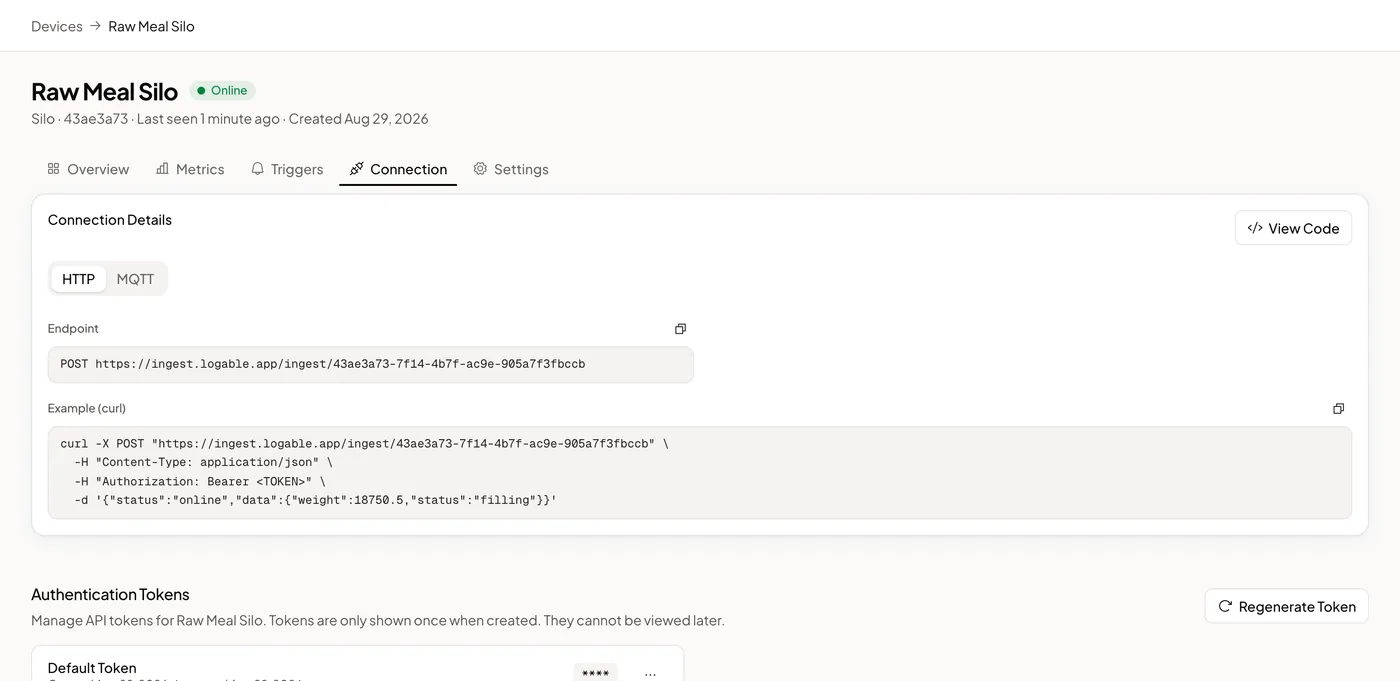
Open the belt's Connection tab. The device log shows each message as it arrives, with the payload. A value the type does not expect, a wrong topic or an expired token each appear as a row with the reason.
Show a different unit on one reading#
Your indicator may report weight in kilograms and a totaliser in tons. Each reading can show the unit that matches your indicator.
Rate, Capacity, Totaliser 1 and Totaliser 2 can each have their own unit. Weight unit is the default for all of them. If you choose Same as Weight unit, the reading uses the Weight unit. Every weight reading without its own unit shows the Weight unit.
To give a reading its own unit:
- Open the belt and select the Settings tab.
- Find Rate unit, Capacity unit, Totaliser 1 unit or Totaliser 2 unit.
- Choose Kilograms (kg), Tons (t) or Pounds (lbs), and save.
To make a reading follow the Weight unit again, open the same field and choose the first option. It reads Same as Weight unit, with your current Weight unit in brackets, for example Same as Weight unit (kg).
The Rate unit also applies to Maximum rate, per hour. The Capacity unit applies to Maximum weight.
The overloaded alert needs matching units#
The Belt overloaded alert compares the load with Maximum weight. Capacity and Weight must use the same unit for that to be a fair test.
When they differ, the preset is not available, and its card says why. An overloaded alert you added earlier shows a warning on the Triggers tab.
To fix it, do one of these:
- Set the Capacity unit to the same unit as the Weight unit.
- Choose Same as Weight unit for the Capacity unit.
Logable never converts a unit inside an alert.
Read next#
- Belt scale monitoring, the whole picture for a plant with several belts.
- Conveyor device type reference, every metric and configuration field.
- Connect PLCs and Modbus devices via a gateway, the gateway between Modbus and MQTT.