See the whole plant.
On one screen, no developer.
Every silo, pump and conveyor on one dashboard, built by dragging boxes into place. Each one updates the moment new data arrives.
- One screen
- every silo, motor, conveyor
- Updates live
- no refresh, no polling
- No code needed
- drag it into place
See the reading, not just the number
Charts, gauges and tables for any metric, plus a purpose-built visual for each device type. Every widget below is the product's own, drawn at the size it renders on a dashboard.
Uptime 99.6% this month
| loaderId | payload | material | cycleTime |
|---|---|---|---|
| Quarry Loader 1 | 12.4 t | limestone | 6.2 min |
| Quarry Loader 2 | 11.8 t | limestone | 6.9 min |
| Quarry Loader 1 | 12.1 t | shale | 7.4 min |
Line Chart
Time-series visualization
Area Chart
Volume and trend visualization
Bar Chart
Category comparison
Pie Chart
Proportional distribution
Radar Chart
Multi-dimensional comparison
Gauge
Single-metric radial display
Silo Visualization
Fill level monitoring
Conveyor Monitoring
Belt speed, throughput and belt scale totals
Weigh Bin
Weight measurement
Check Weigher
Count & weight verification
Motor Visualization
RPM, power, temperature
Scale Visualization
Precision weighing
Flow Meter
Flow rate measurement
Water Pump
Pressure & flow monitoring
Cold Room
Temperature & humidity monitoring
Front Loader
Load & position tracking
Inverter
Frequency & power conversion
Water Tank
Water level monitoring
Dam
Reservoir level & volume
Stat Card
Single-value KPI with trend
Status Card
Device health indicator
Data Table
Paginated view with real-time updates
Your Custom Widget
Need a specialized visualization? We build custom widgets for your unique requirements.
Contact UsThe same dashboard, in your pocket.
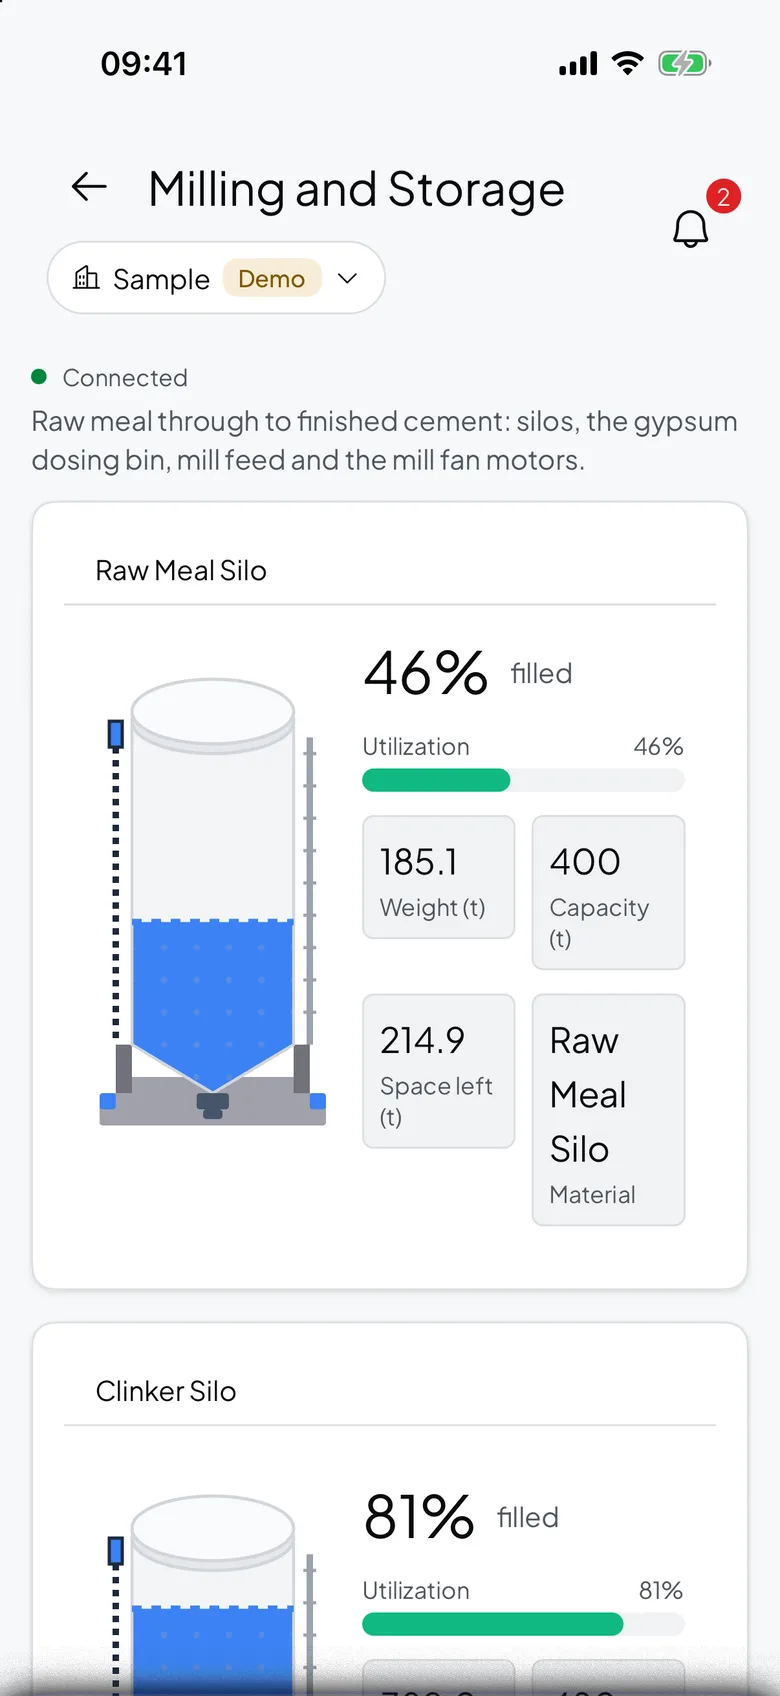
The floor manager checks the mill on the walk over and sees the same widgets, the same numbers, updating as they change. Nothing extra to install.
- Every widget on the phoneGauges, charts and silo levels render exactly as they do on the desktop dashboard.
- Still live, still updatingThe same data feed, so the reading on the phone matches the one on the wall screen.
- Viewers see the same pictureAnyone with view access gets the dashboard as it is, read-only, no editing on the go.
Built by dragging, not by ticket
Place a widget, resize it, share it. Nobody waits on a developer to see the plant.
Build it by dragging, not coding
Place, resize and arrange widgets on a grid. No code, no developer, no waiting on a request to IT.
Every widget updates itself
Each one reads live data from your devices and streams. Nobody refreshes the page to see the current reading.
Compare sites on one screen
Put readings from several devices, or several sites, on a single dashboard for a shift handover or a morning check.
Reads well on the wall or the desk
Light, dark or a custom theme, sized for a laptop screen or a wall-mounted display in the control room.
Share it, control who edits
Give your team the dashboard without giving everyone the ability to rearrange it. Viewers get a live, read-only picture.
A shape for every machine
Purpose-built widgets for silos, conveyors, motors, pumps, scales and more, not a generic chart forced to fit.
Drag a silo onto the page. It is already filling.
Every widget reads live data from the moment you place it. No setup step, no waiting for the first reading.
Build the first dashboard before lunch
Drag a widget onto the page and watch it fill with live data.