Monitor a pump remotely
Put pump discharge pressure, flow and power on a live dashboard, and alert before a closed valve damages a seal.
A pump tells you what it is doing through three readings: what it is pushing against, what it is moving, and what it is drawing. This guide takes one pump from an empty account to a live dashboard and a working alert.
1. Add the pump as a device#
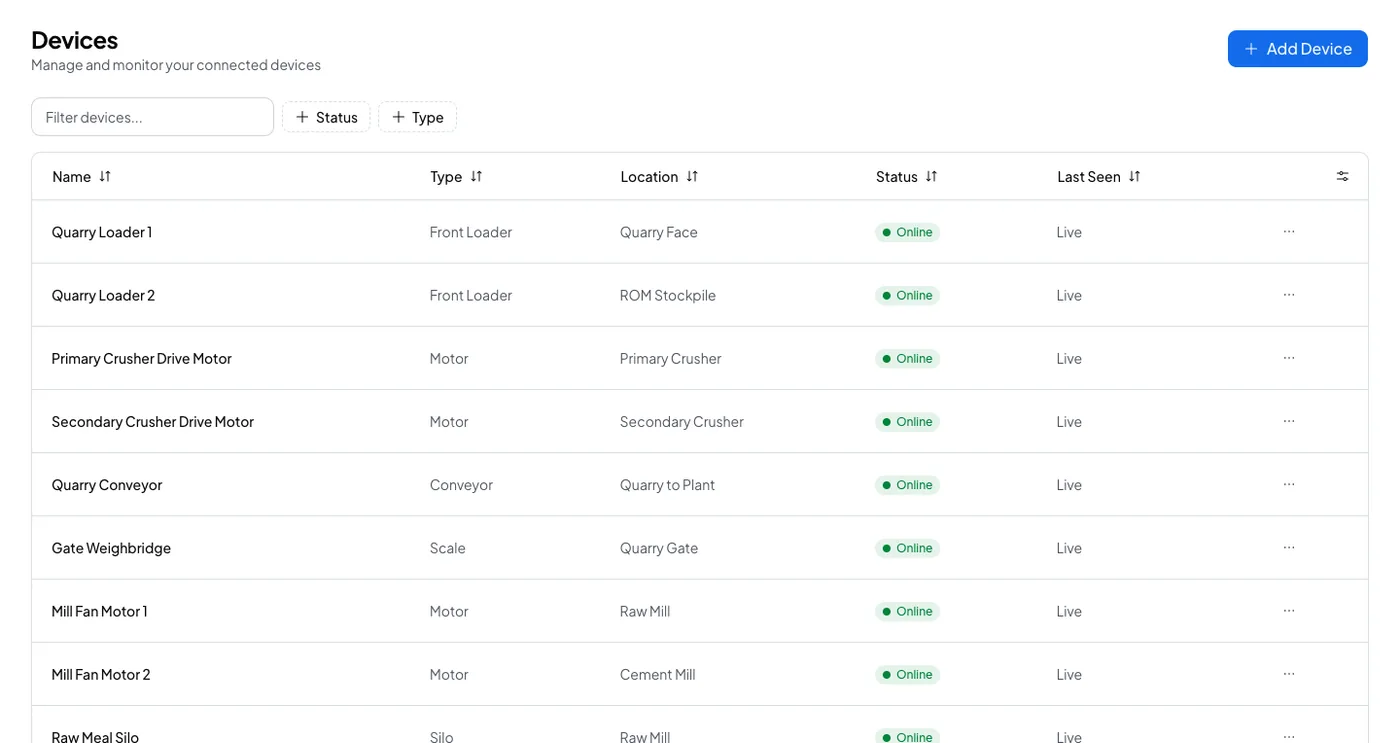
Open Devices, select Add Device, and pick the Water pump type. Name it after the asset, such as "Transfer Pump 1".
The configuration decides what the preset compares against:
- Maximum pressure, the pump's rated discharge pressure. The over pressure preset fires at 90 percent of it.
- Maximum flow rate, the rated duty point.
- Pressure unit and Flow unit, which fix how the readings are shown.
- Pump type, which is a label.
2. Copy the credentials#
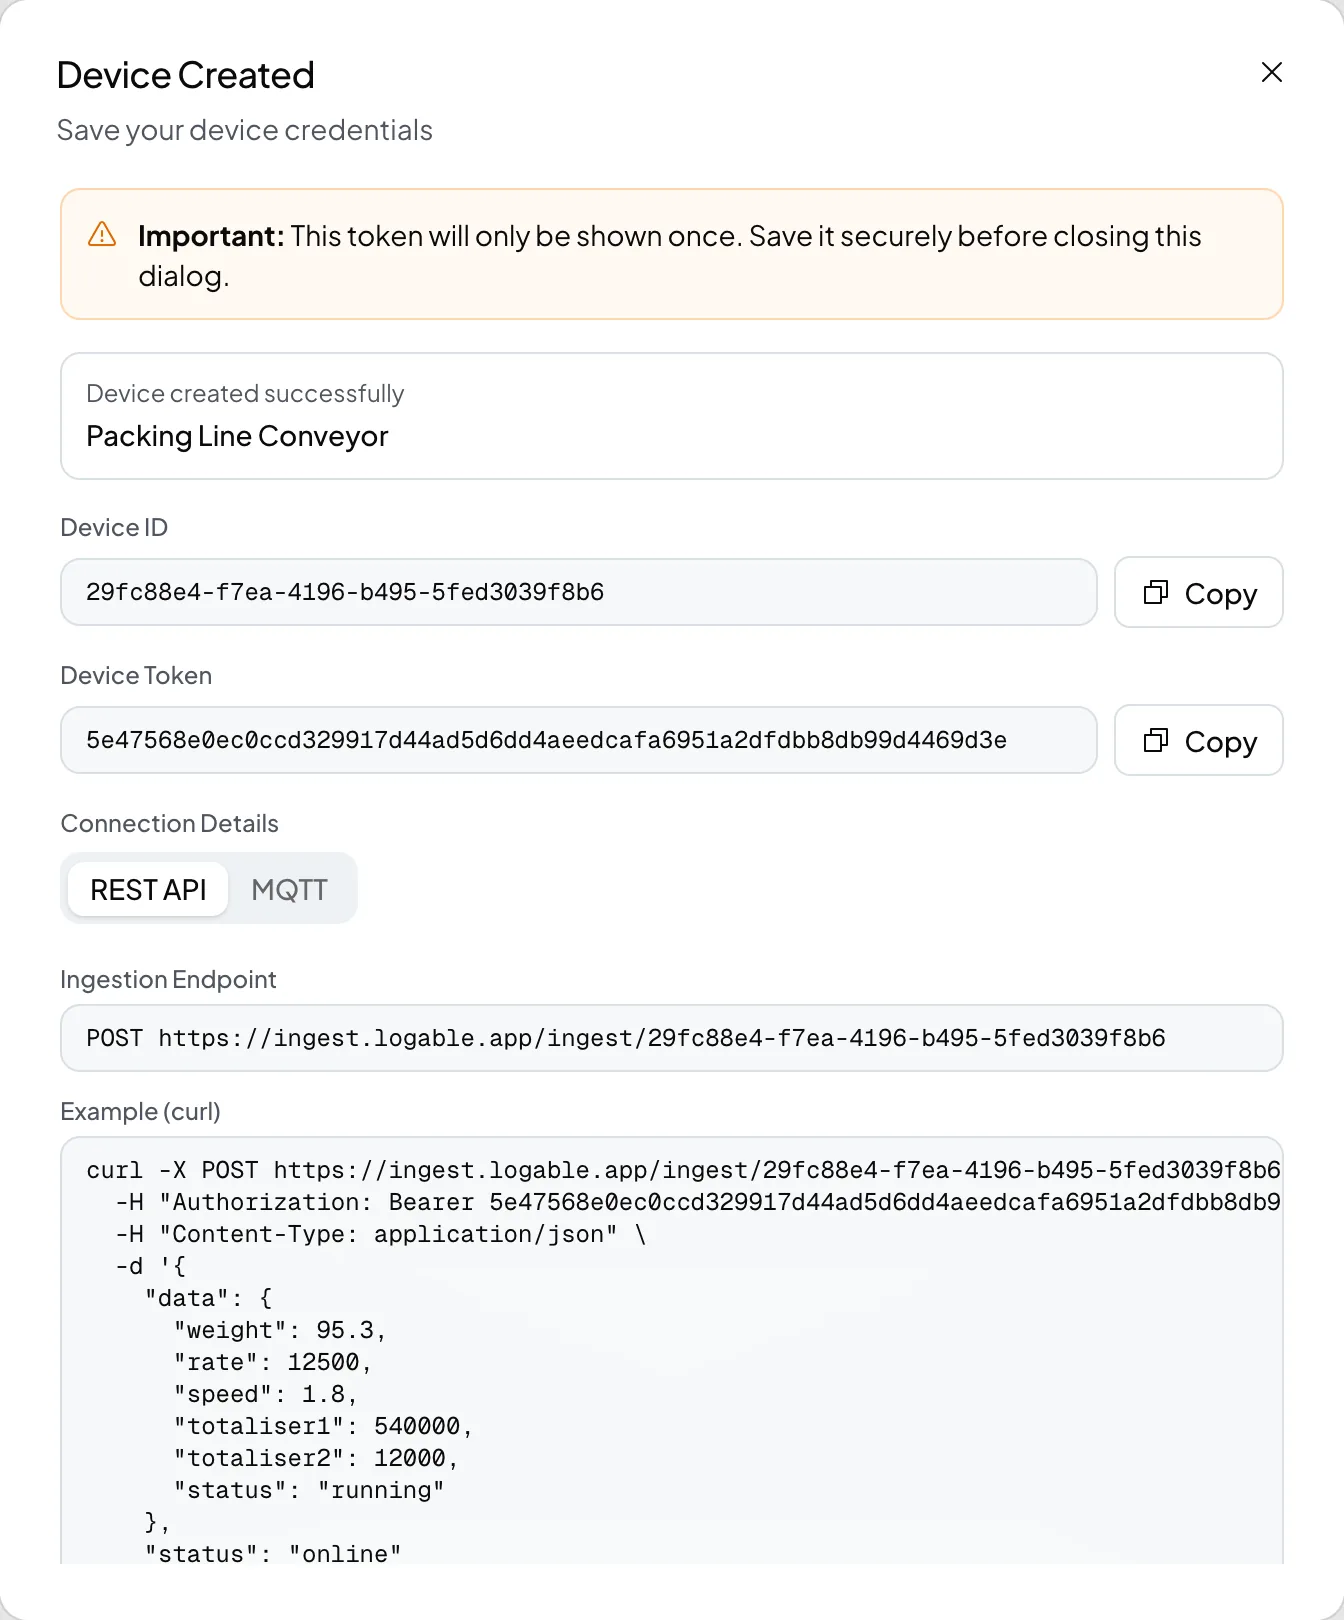
Step 4 of the wizard shows the Device ID and the Device Token, once. Copy both, or select Download Credentials. They become the username and password on the gateway's MQTT client.
3. Send the readings#
| Metric | What it is |
|---|---|
pressure | Discharge pressure, in bar |
flowRate | What the pump is moving, in litres per minute |
power | What the motor is drawing, in kilowatts |
temperature | Motor or bearing temperature, in degrees Celsius |
{
  "timestamp": "2026-09-12T08:30:00.000Z",
  "status": "online",
  "data": { "pressure": 4.8, "flowRate": 172.5, "power": 11.4 }
}
Send a reading every ten to thirty seconds. Pressure changes quickly, and the over pressure preset waits for three agreeing readings before it fires.
A pressure transmitter usually gives 4-20 mA, which a gateway or a PLC reads and turns into a number. If the reading already sits on a PLC, the gateway polls it over Modbus. See Connect PLCs and Modbus devices via a gateway.
4. Put it on a dashboard#
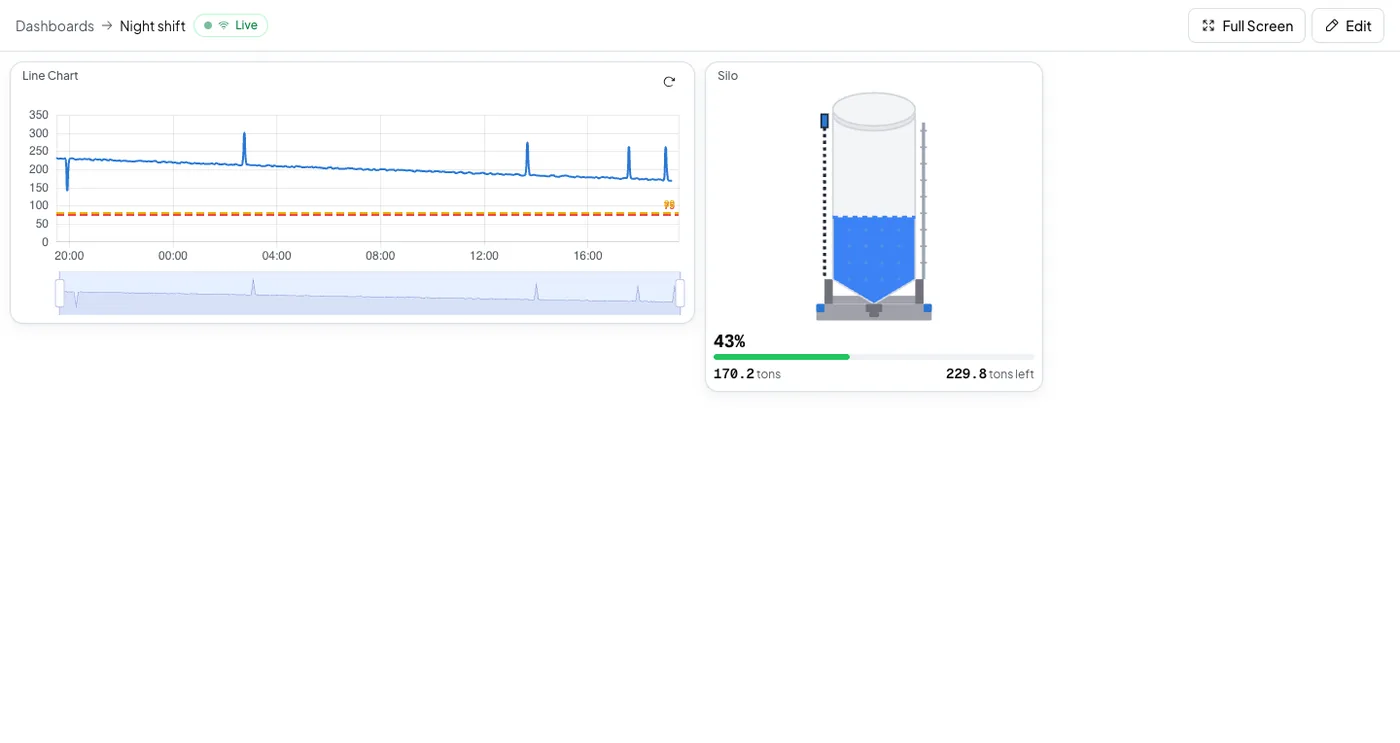
Open Dashboards, select Create dashboard, then Create from template, and choose Pump. It lays out pressure, flow and power together, so one glance says whether the pump is doing work or fighting something.
5. Add the alerts#
Open the pump's Triggers tab and select Browse presets.
| Preset | Fires at | What you do |
|---|---|---|
| Over pressure | 90 percent of the maximum pressure you set | Find the closed valve or the blockage |
| Not reporting | Five minutes of silence, or three times the reporting interval when that is longer | Check the gateway, the SIM and the power |
If the pump draws from a metered supply, add Low flow on the flow meter as well. It covers the supply side, which is where a dry run starts.
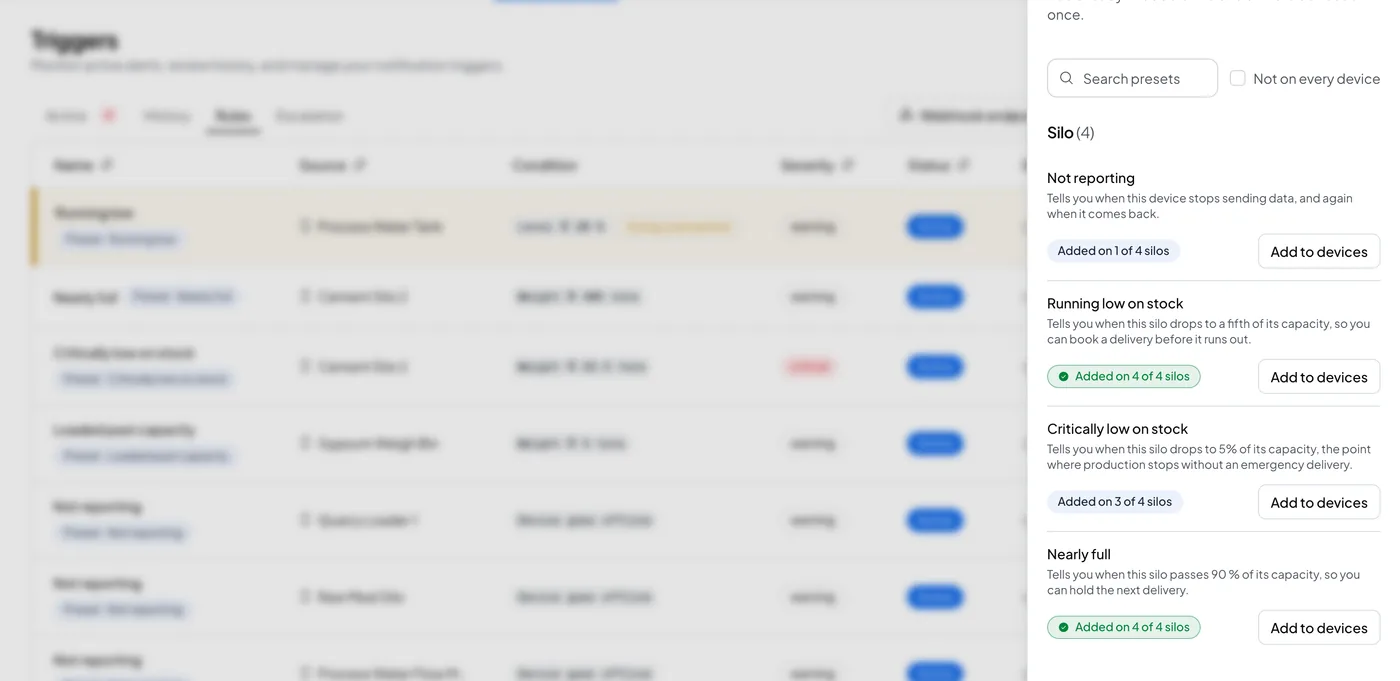
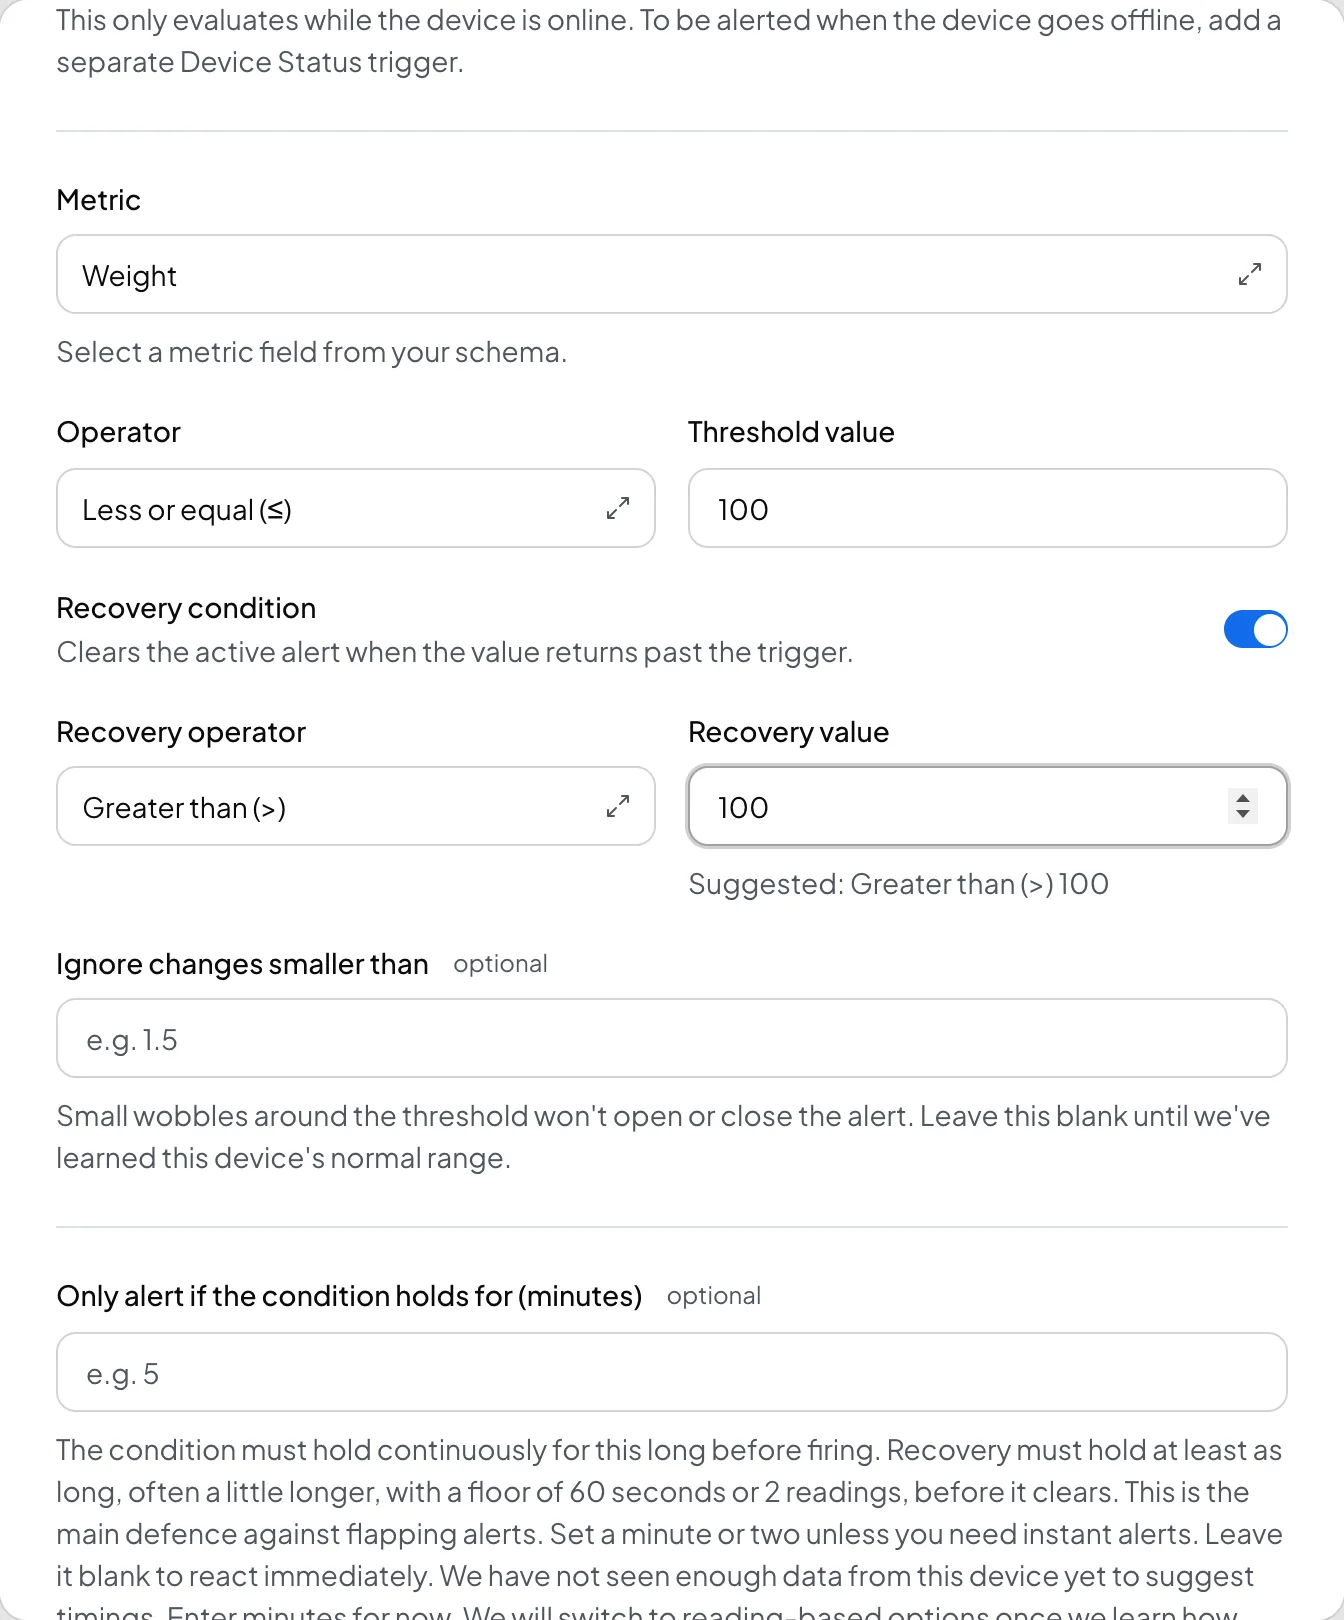
If a preset does not fit, select Create Trigger on the same tab instead. Set the metric, the operator, the threshold, and a recovery condition that clears the alert when the reading passes back over it.
6. Check it arrived#
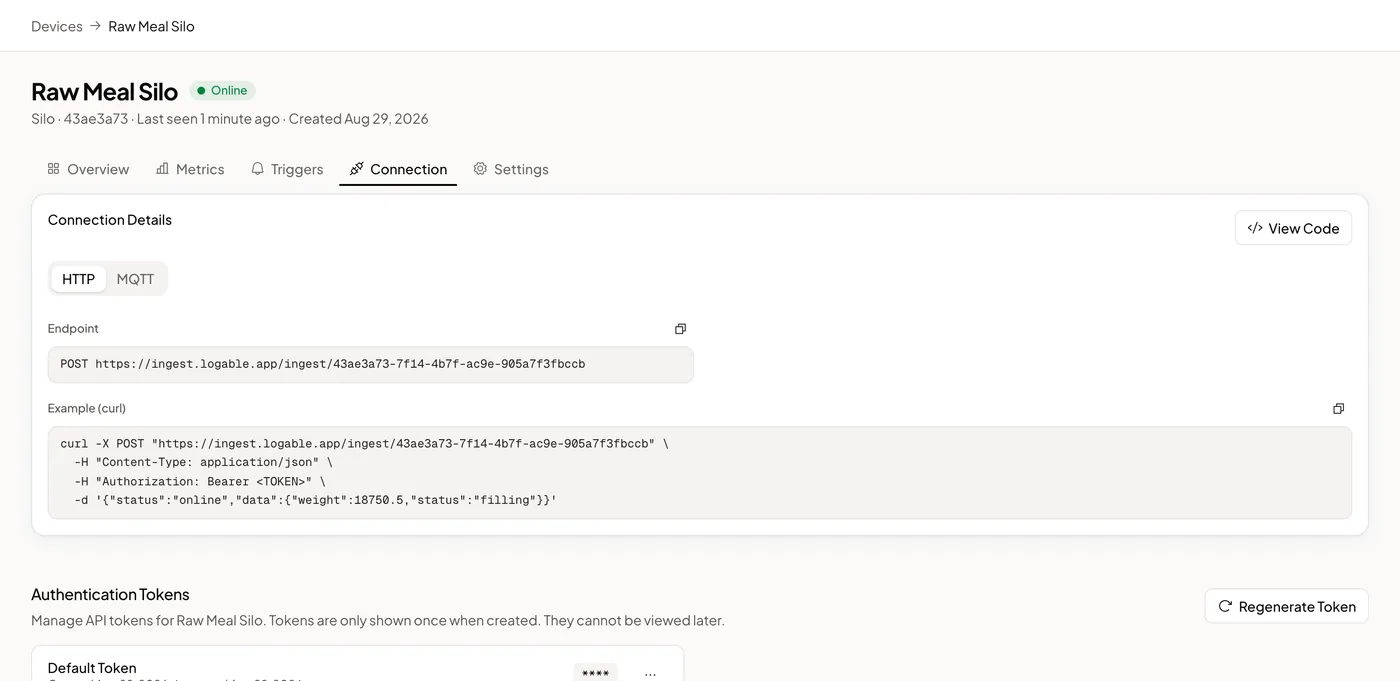
Open the pump's Connection tab. The device log shows every message, every rejection and the reason for it.
Read next#
- Pump monitoring, the whole picture for a site with several pumps.
- Detect pump failure remotely, the failure catalogue.
- Water pump device type reference, every metric and configuration field.