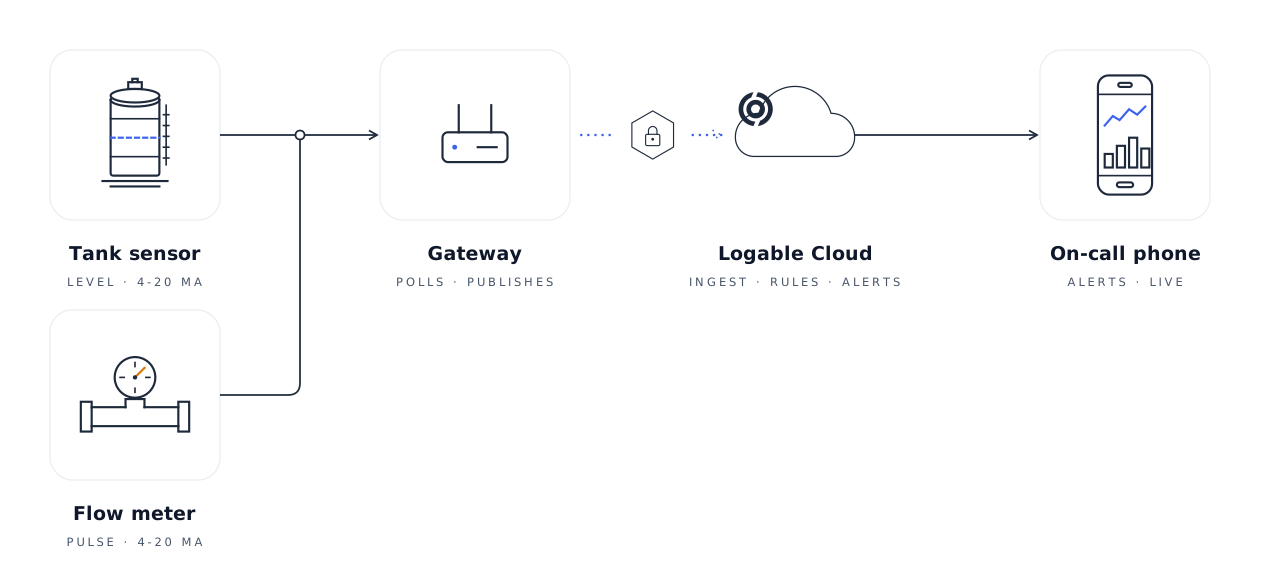
Connecting a new device is the one moment where Logable used to go quiet on you. If the device published to the wrong topic, or with the wrong token, nothing arrived, and nothing told you why. You checked the wiring, the gateway, the SIM, and the answer was in none of them.
That is fixed. The debug console on every device is now the device log, and it tells you what actually happened. The short version:
Where to find it#
On the web, open a device and go to the Connection tab. In the mobile app, open a device and choose Device log from the menu. Both show the same rows with the same wording, live.
What a rejection looks like#
Say a belt scale gateway is set up to publish to
devices/<id>/telemetry instead of devices/<id>/data. Before, that
data vanished without a trace. Now the log shows:
Rejected. Published to an unknown topic. Publish device data to
devices/<id>/data.
Every rejection follows that pattern: what happened, in one sentence, and the fix, in one more. The same goes for a payload that is not valid JSON, a metric sent as text where a number is expected, a message over the size limit, or a device sending faster than the rate limit allows. When the same problem repeats in a burst, the log shows one row with a count instead of a wall of identical rows.
Authentication problems show up too. A device connecting with a token that does not match is a row in the log, not a silent nothing.
Connects, disconnects, and the keepalive#
The broker now reports session events into the log. When your device connects you see its address, protocol and keepalive. When it drops you see why: the connection closed, another client took over the ID, or no keepalive arrived in time. That last one comes with its own hint, because a missed keepalive is the most common reason a device that "works on the bench" keeps falling offline on site.
You do not have to be watching#
The most recent problem also shows as a one-line notice on the device overview, with the time and a link to the log. It clears on its own the moment the device sends an accepted reading. So if a silo sensor failed authentication at 06:00, the device page says so at 09:00, and says nothing once the problem is gone.
Made for commissioning#
The log has filters for exactly the moments you need them: Received while you confirm data is flowing, Problems while you hunt down a rejection, Session while you watch a flaky connection, and All for the full picture. You can pause the stream while you read, then resume, and nothing in the log requires any setup on the device side. Your devices connect and publish exactly as before.
Every rejection reason is documented, with the same wording you see in the log, in the error code reference.
What you need to do#
Nothing. The device log is on every device already, and the next device you commission will tell you what it is doing while you stand next to it.