The number, without the walk
One dashboard for every vessel on the site, updating as the readings arrive.
LogableRiverside Cement WorksJD
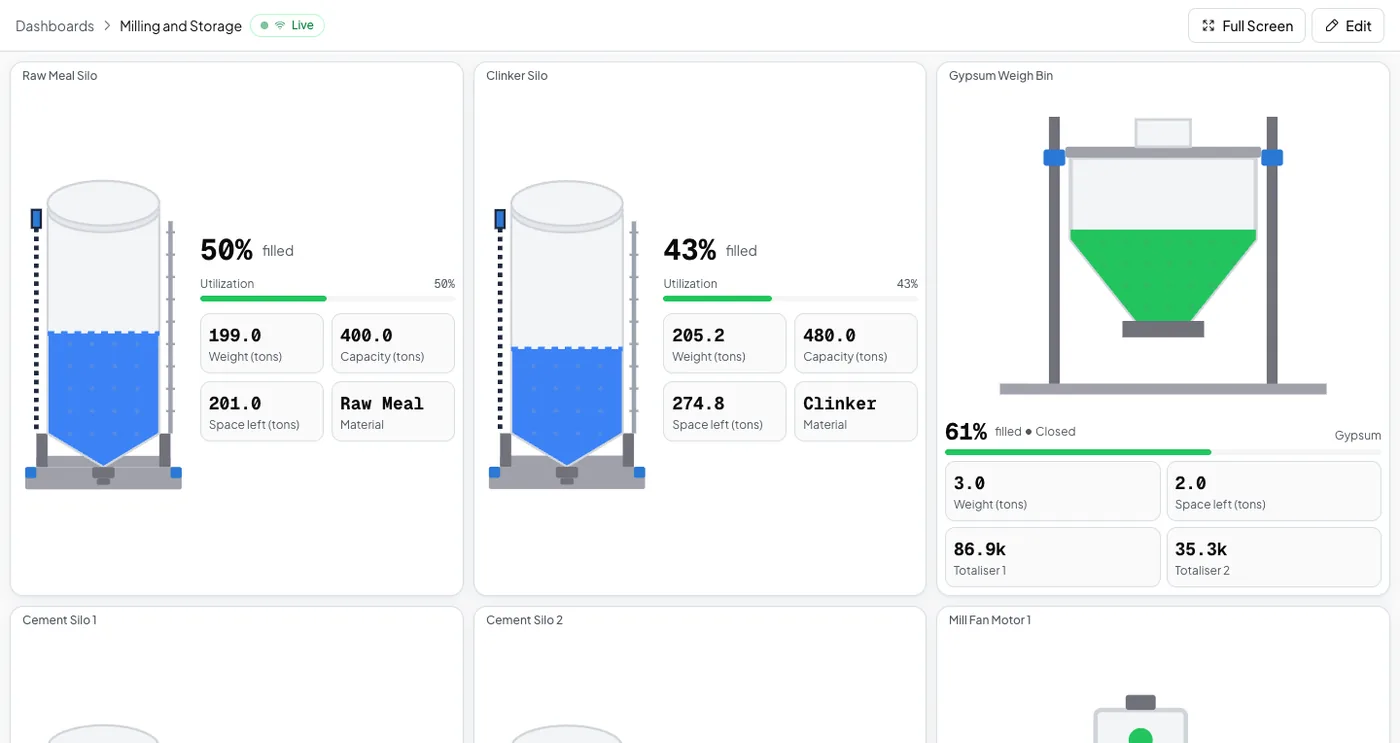
A dipstick and a spreadsheet answer the question once a week. A sensor answers it every few minutes, and tells somebody when the number is wrong.
A manual check is a real answer, and for one vessel on a route somebody already walks it is often the right one. The question is what happens between two checks.
If a person passes the silo every shift and the level moves slowly, a reading on a whiteboard is enough.
A silo that runs out over a weekend, or a tank that drains overnight, is found late by a walked route.
A limit crossed at 02:00 reaches whoever is on shift. A spreadsheet is read the next time somebody opens it.
The left column is the practice, not a product, so no row carries a source link. The right column is checked in the product.
| Manual checks | Logable | |
|---|---|---|
| Dashboards | A spreadsheet per site, or a whiteboard at the silo. The numbers are as fresh as the last walk. | Yes. A drag and drop dashboard builder. 50 dashboards on every plan. |
| Alert rules | A person notices the number is wrong, or nobody does until the next check. | Yes. Trigger rules with ready-made presets, deadband, confirmation samples and dwell. No per-plan limit on the number of rules. |
| Escalation and quiet hours | Nobody is told automatically. The reading is passed on by phone or in the shift handover. | Yes. Escalation policies with stages and quiet hours. Alerts reach email, push and the in-app inbox. |
| Reports | A monthly sheet, typed up from the daily sheets. | Yes. A report builder on Growth and above. Saved and scheduled reports on Business and above. |
| Mobile app | A photograph of the sheet, or a message in a group chat. | Partial. An iOS and Android app for dashboards, devices and alerts, with push alerts on Growth and above. The public store listings are not open yet. |
| How it is priced | The time of the person who walks the route, plus the cost of a number that was wrong. | A flat price per plan, sized by device count. Monthly or annual, where annual pays for ten months. |
| Entry price | No subscription. A dipstick, a ladder and a clipboard. | Starter is R399 a month for 8 devices, or USD 25. A 14 day trial covers 5 devices and asks for no card. |
| Data retention | As long as the file is kept. Older sheets are usually in a box. | Raw readings for 60 days. Hourly and daily summaries are kept after that. |
Checked on 12 September 2026.
If a row here is wrong, tell us and we will correct it. Report a correction.
Five situations where a sensor and a subscription buy you nothing.
Four things the clipboard cannot do, whoever is holding it.
A weekly number tells you what already happened.
A reading every few minutes tells you what is happening now, and an alert tells somebody before the silo runs out.
One sensor and one path out of the site. A level sensor or a set of load cells feeds a gateway or a controller, which publishes to Logable over MQTT or HTTPS. The dashboard and the first alert come from a template and a preset, so the first reading is on a screen the same day. The clipboard can stay: many sites keep the weekly count for a month and compare the two.
One dashboard for every vessel on the site, updating as the readings arrive.
Reservoir Tank reads 18 percent, below the 20 percent limit. Nobody is due on that route until the morning, and whoever is on shift already knows.
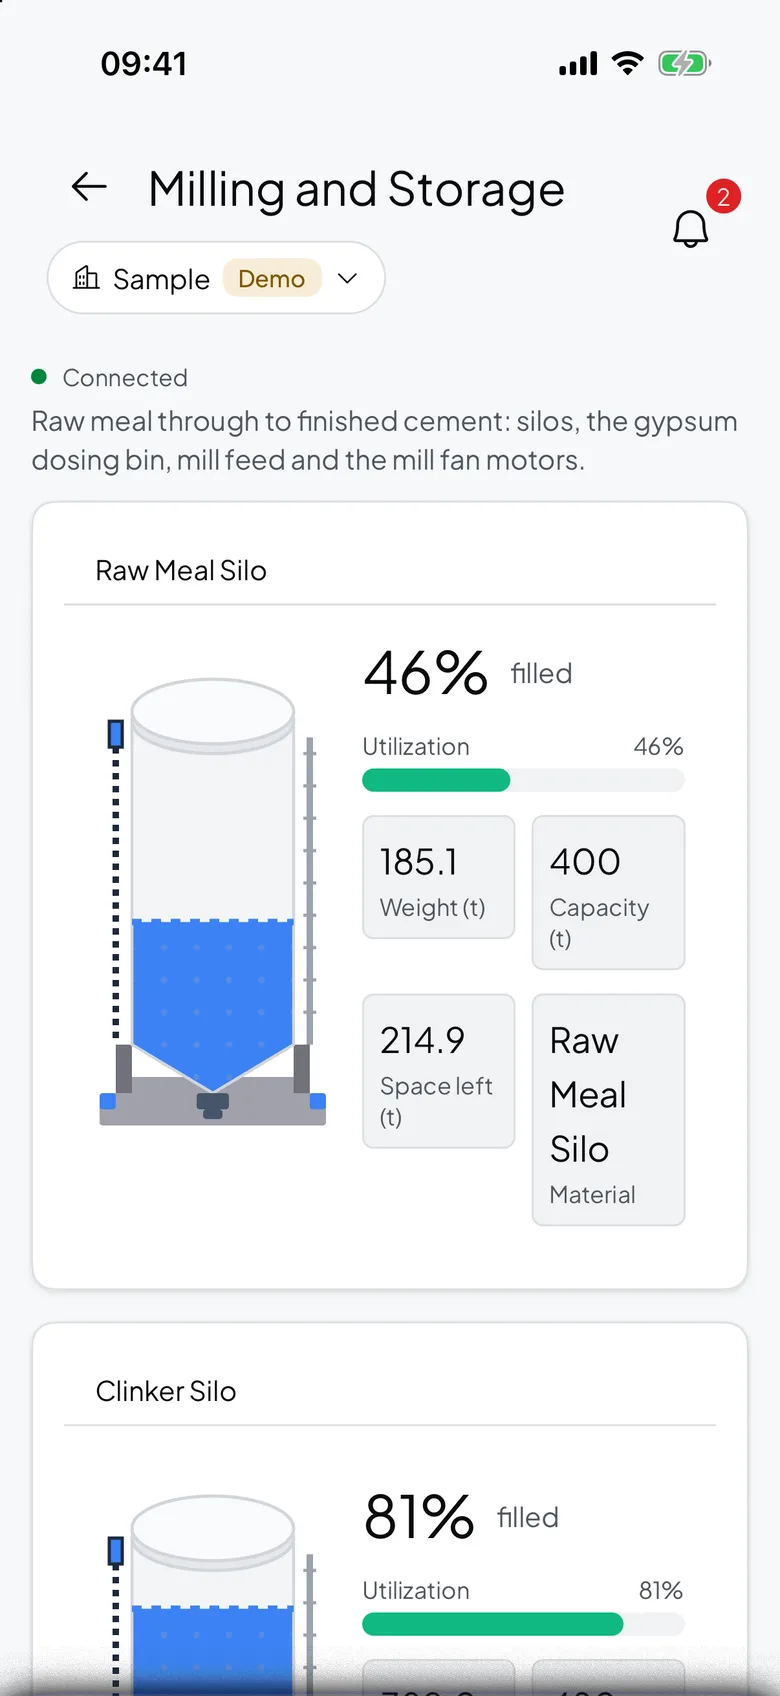
No. Most sites keep the weekly count for the first month and compare it against the live reading. The count settles whether the sensor is calibrated, and after that it usually drops to a monthly check.
A sensor, power at the sensor, and one path out of the site: a fixed line, a 4G router or a link to a building that has one. The gateway makes one outbound connection over MQTT or HTTPS, so no inbound port has to be opened.
Yes. A report exports as a file, and a chart's data can be downloaded. The difference is that the export is produced from readings that were taken automatically, rather than typed in from a sheet.
Open the live demo, or talk to us about the vessels you check by hand today.